

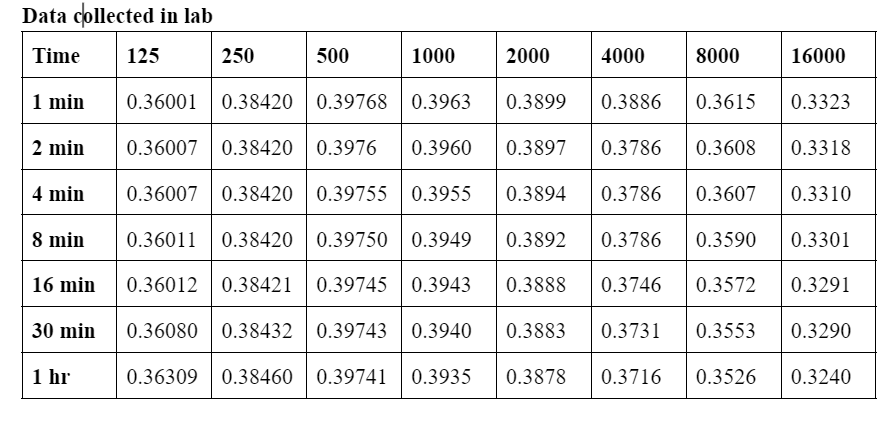
Question: 2 . From the class data collectively, plot void ratio versus logarithm of effective stress. Calculate the following and show all calculations: Maximum preconsolidation pressure
From the class data collectively, plot void ratio versus logarithm of effective stress. Calculate the following and show all calculations: Maximum preconsolidation pressure computed using Casagrandes method, show all construction lines on your plot Recompression index, Cr Compression index, Cc Swell index, Cs computed from unload portion of curve From the class data, plot cv yaxis versus logarithm of the average effective stress avg xaxis Plot values for the loading increments only unloading increments should not be included Discuss how you would select a value of cv for a settlement analysis.
Step by Step Solution
There are 3 Steps involved in it
1 Expert Approved Answer
Step: 1 Unlock

Question Has Been Solved by an Expert!
Get step-by-step solutions from verified subject matter experts
Step: 2 Unlock
Step: 3 Unlock