

Question: 2) From the given x and y data in the table below: a) Calculate the correlation coefficient r . (round to 3 decimal places) b)
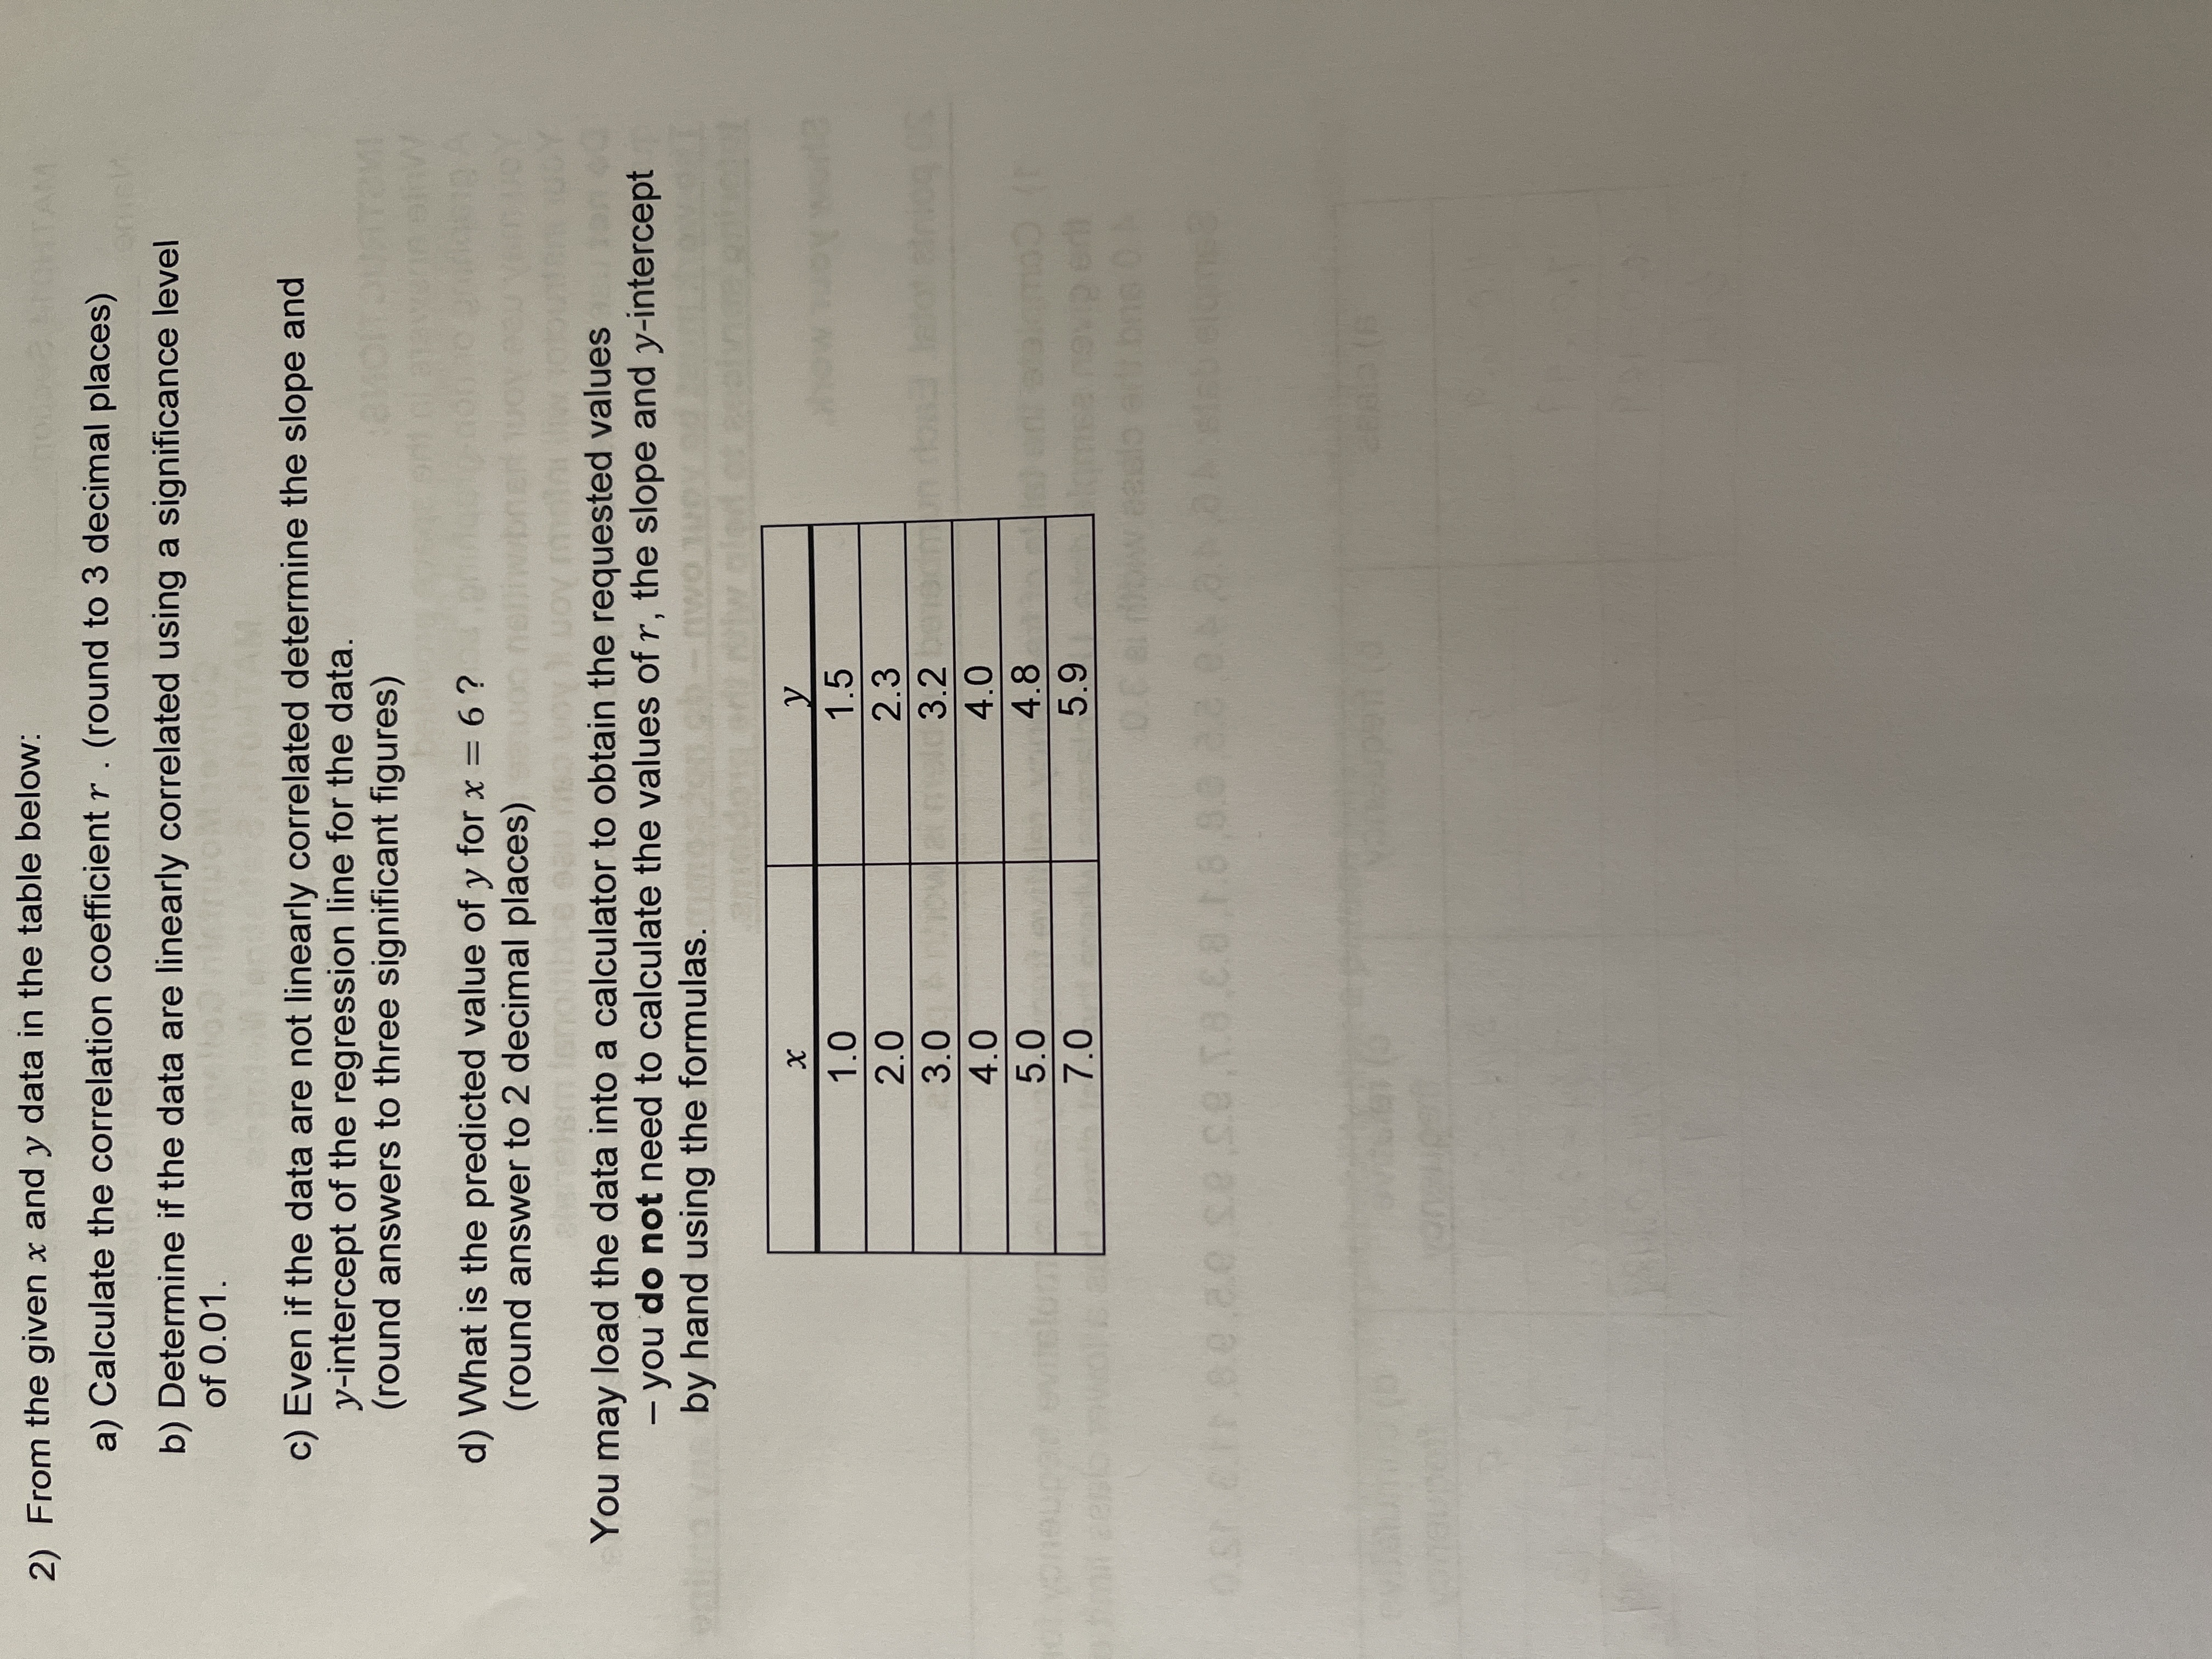
2) From the given x and y data in the table below: a) Calculate the correlation coefficient r . (round to 3 decimal places) b) Determine if the data are linearly correlated using a significance level of 0.01. c) Even if the data are not linearly correlated determine the slope and y-intercept of the regression line for the data. (round answers to three significant figures) d) What is the predicted value of y for x = 6 ? (round answer to 2 decimal places) You may load the data into a calculator to obtain the requested values - you do not need to calculate the values of r, the slope and y-intercept by hand using the formulas. x 1.0 1.5 2.0 2.3 3.0 3.2 4.0 4.0 5.0 4.8 7.0 5.9 meanovperil
Step by Step Solution
There are 3 Steps involved in it

Get step-by-step solutions from verified subject matter experts