

Question: ( 2 ) Generate a surface plot of the following equation. ( 6 p t s ) Z = s i n x * *
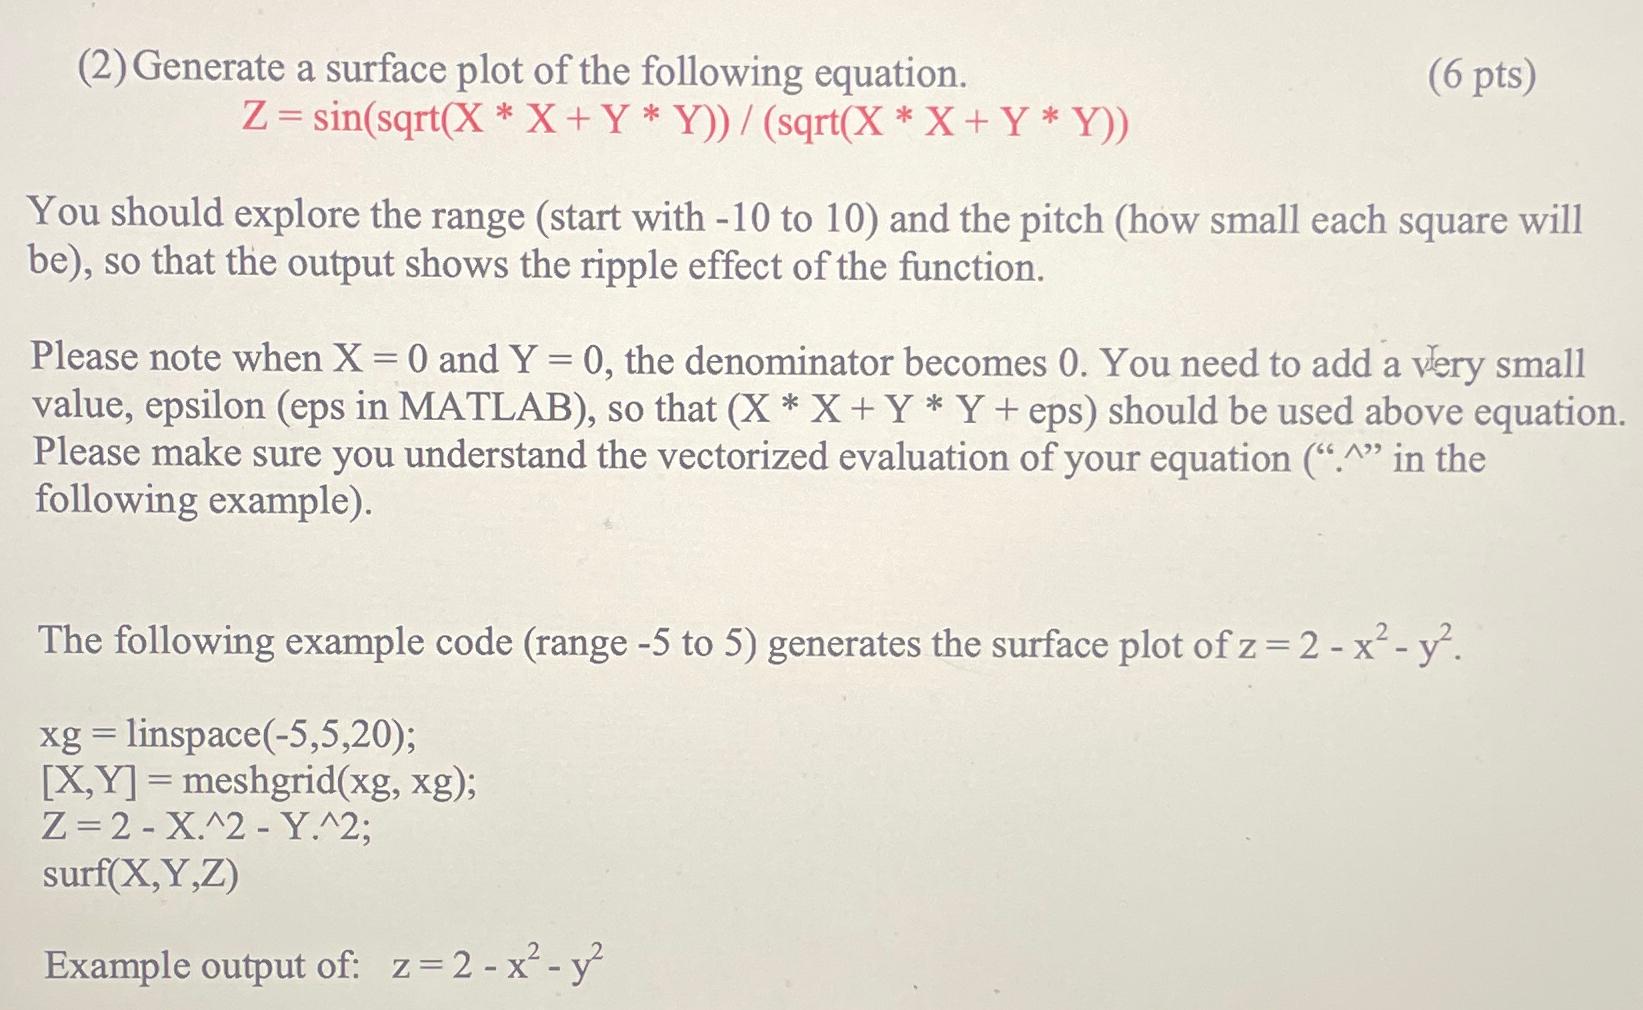
Generate a surface plot of the following equation.
You should explore the range start with to and the pitch how small each square will be so that the output shows the ripple effect of the function.
Please note when and the denominator becomes You need to add a very small value, epsilon eps in MATLAB so that eps should be used above equation. Please make sure you understand the vectorized evaluation of your equation in the following example
The following example code range to generates the surface plot of
linspace
meshgrid
surf
Example output of:
Step by Step Solution
There are 3 Steps involved in it
1 Expert Approved Answer
Step: 1 Unlock

Question Has Been Solved by an Expert!
Get step-by-step solutions from verified subject matter experts
Step: 2 Unlock
Step: 3 Unlock