

Question: 2. Graph below shows costs, price (vertical axis), and quantity of good X (horizontal axis) for firm A operating in a perfectly competitive market. (8
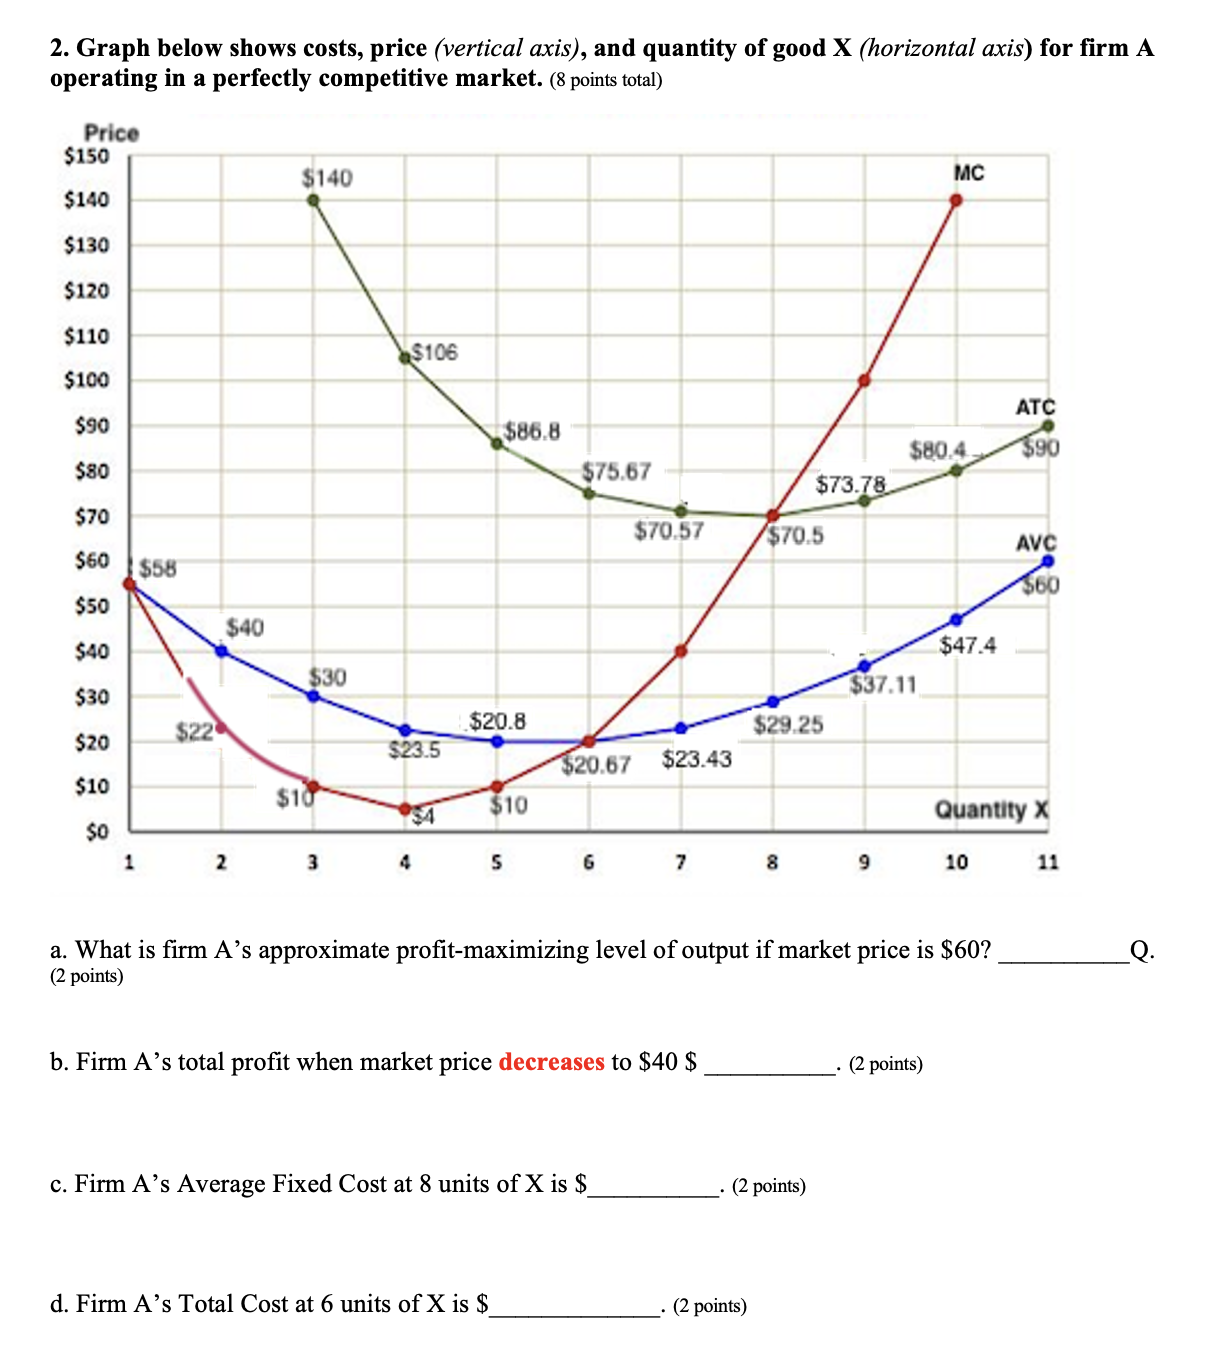
2. Graph below shows costs, price (vertical axis), and quantity of good X (horizontal axis) for firm A operating in a perfectly competitive market. (8 points total) Price $150 $140 $140 mc $130 $120 $110 $100 $106 ATC $90 86,8 $80.4 30 $30 - $75.67 $70 $73.78 $70.57 $70.5 AVC 60 }gss $50 - 540 - ) $47.4 $30 $37.1 n, $20.8 $29.25 22 2 - $235 7 $23.43 520,67 $10 10 10 Quantity X $30 a. What is firm A's approximate profit-maximizing level of output if market price is $60? Q. (2 points) b. Firm A's total profit when market price decreases to $40 $ . (2 points) c. Firm A's Average Fixed Cost at 8 units of X is . (2 points) d. Firm A's Total Cost at 6 units of X is $ . (2 points)
Step by Step Solution
There are 3 Steps involved in it

Get step-by-step solutions from verified subject matter experts