

Question: 2) Graph the PW versus the interest rate for values from 0% to 50% for the given cash flow. Is this the typical PW graph
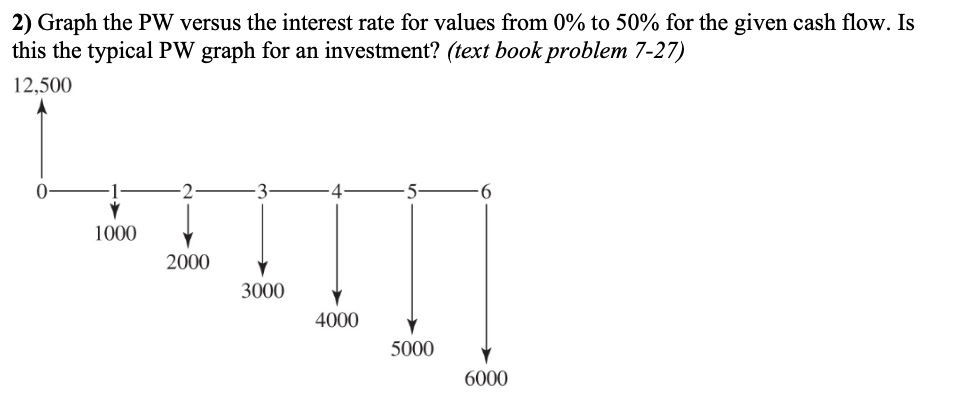
2) Graph the PW versus the interest rate for values from 0% to 50% for the given cash flow. Is this the typical PW graph for an investment? (text book problem 7-27) 12,500 0 4 6 1000 2000 Y 3000 4000 5000 6000
Step by Step Solution
There are 3 Steps involved in it
1 Expert Approved Answer
Step: 1 Unlock

Question Has Been Solved by an Expert!
Get step-by-step solutions from verified subject matter experts
Step: 2 Unlock
Step: 3 Unlock