

Question: 2. (Graphical analysis) Suppose that u=8% and that in period 1,1e=10%. (a) Draw the Phillips curve for an economy at a long-run equilibrium. Include the
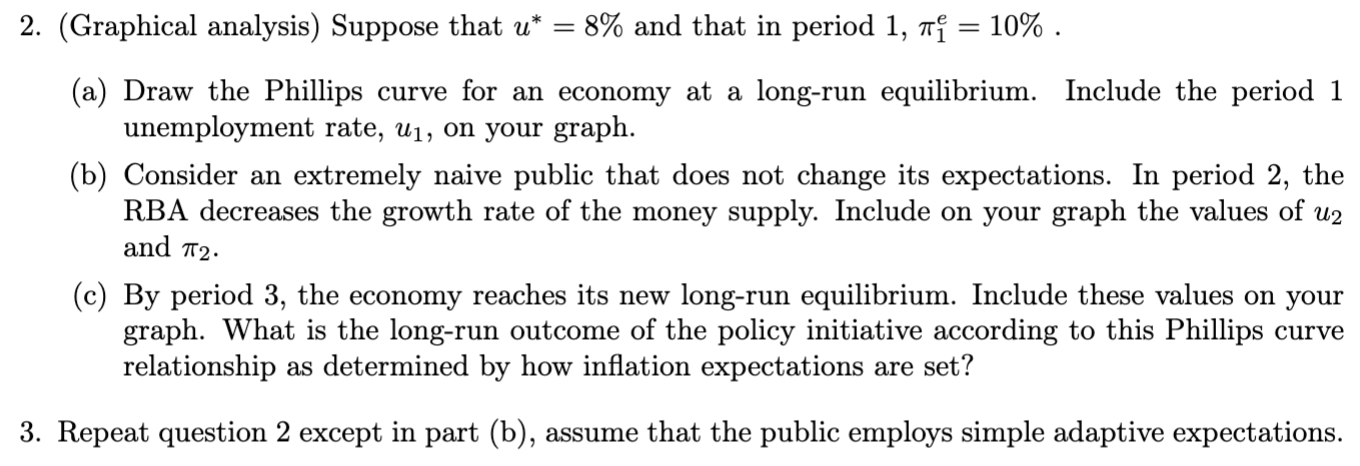
2. (Graphical analysis) Suppose that u=8% and that in period 1,1e=10%. (a) Draw the Phillips curve for an economy at a long-run equilibrium. Include the period 1 unemployment rate, u1, on your graph. (b) Consider an extremely naive public that does not change its expectations. In period 2 , the RBA decreases the growth rate of the money supply. Include on your graph the values of u2 and 2. (c) By period 3, the economy reaches its new long-run equilibrium. Include these values on your graph. What is the long-run outcome of the policy initiative according to this Phillips curve relationship as determined by how inflation expectations are set? 2. (Graphical analysis) Suppose that u=8% and that in period 1,1e=10%. (a) Draw the Phillips curve for an economy at a long-run equilibrium. Include the period 1 unemployment rate, u1, on your graph. (b) Consider an extremely naive public that does not change its expectations. In period 2 , the RBA decreases the growth rate of the money supply. Include on your graph the values of u2 and 2. (c) By period 3, the economy reaches its new long-run equilibrium. Include these values on your graph. What is the long-run outcome of the policy initiative according to this Phillips curve relationship as determined by how inflation expectations are set
Step by Step Solution
There are 3 Steps involved in it

Get step-by-step solutions from verified subject matter experts