

Question: 2. Graphically show the production possibilities frontier for the nation of Stromboli, using the data given in the following table. Does the principle of increasing
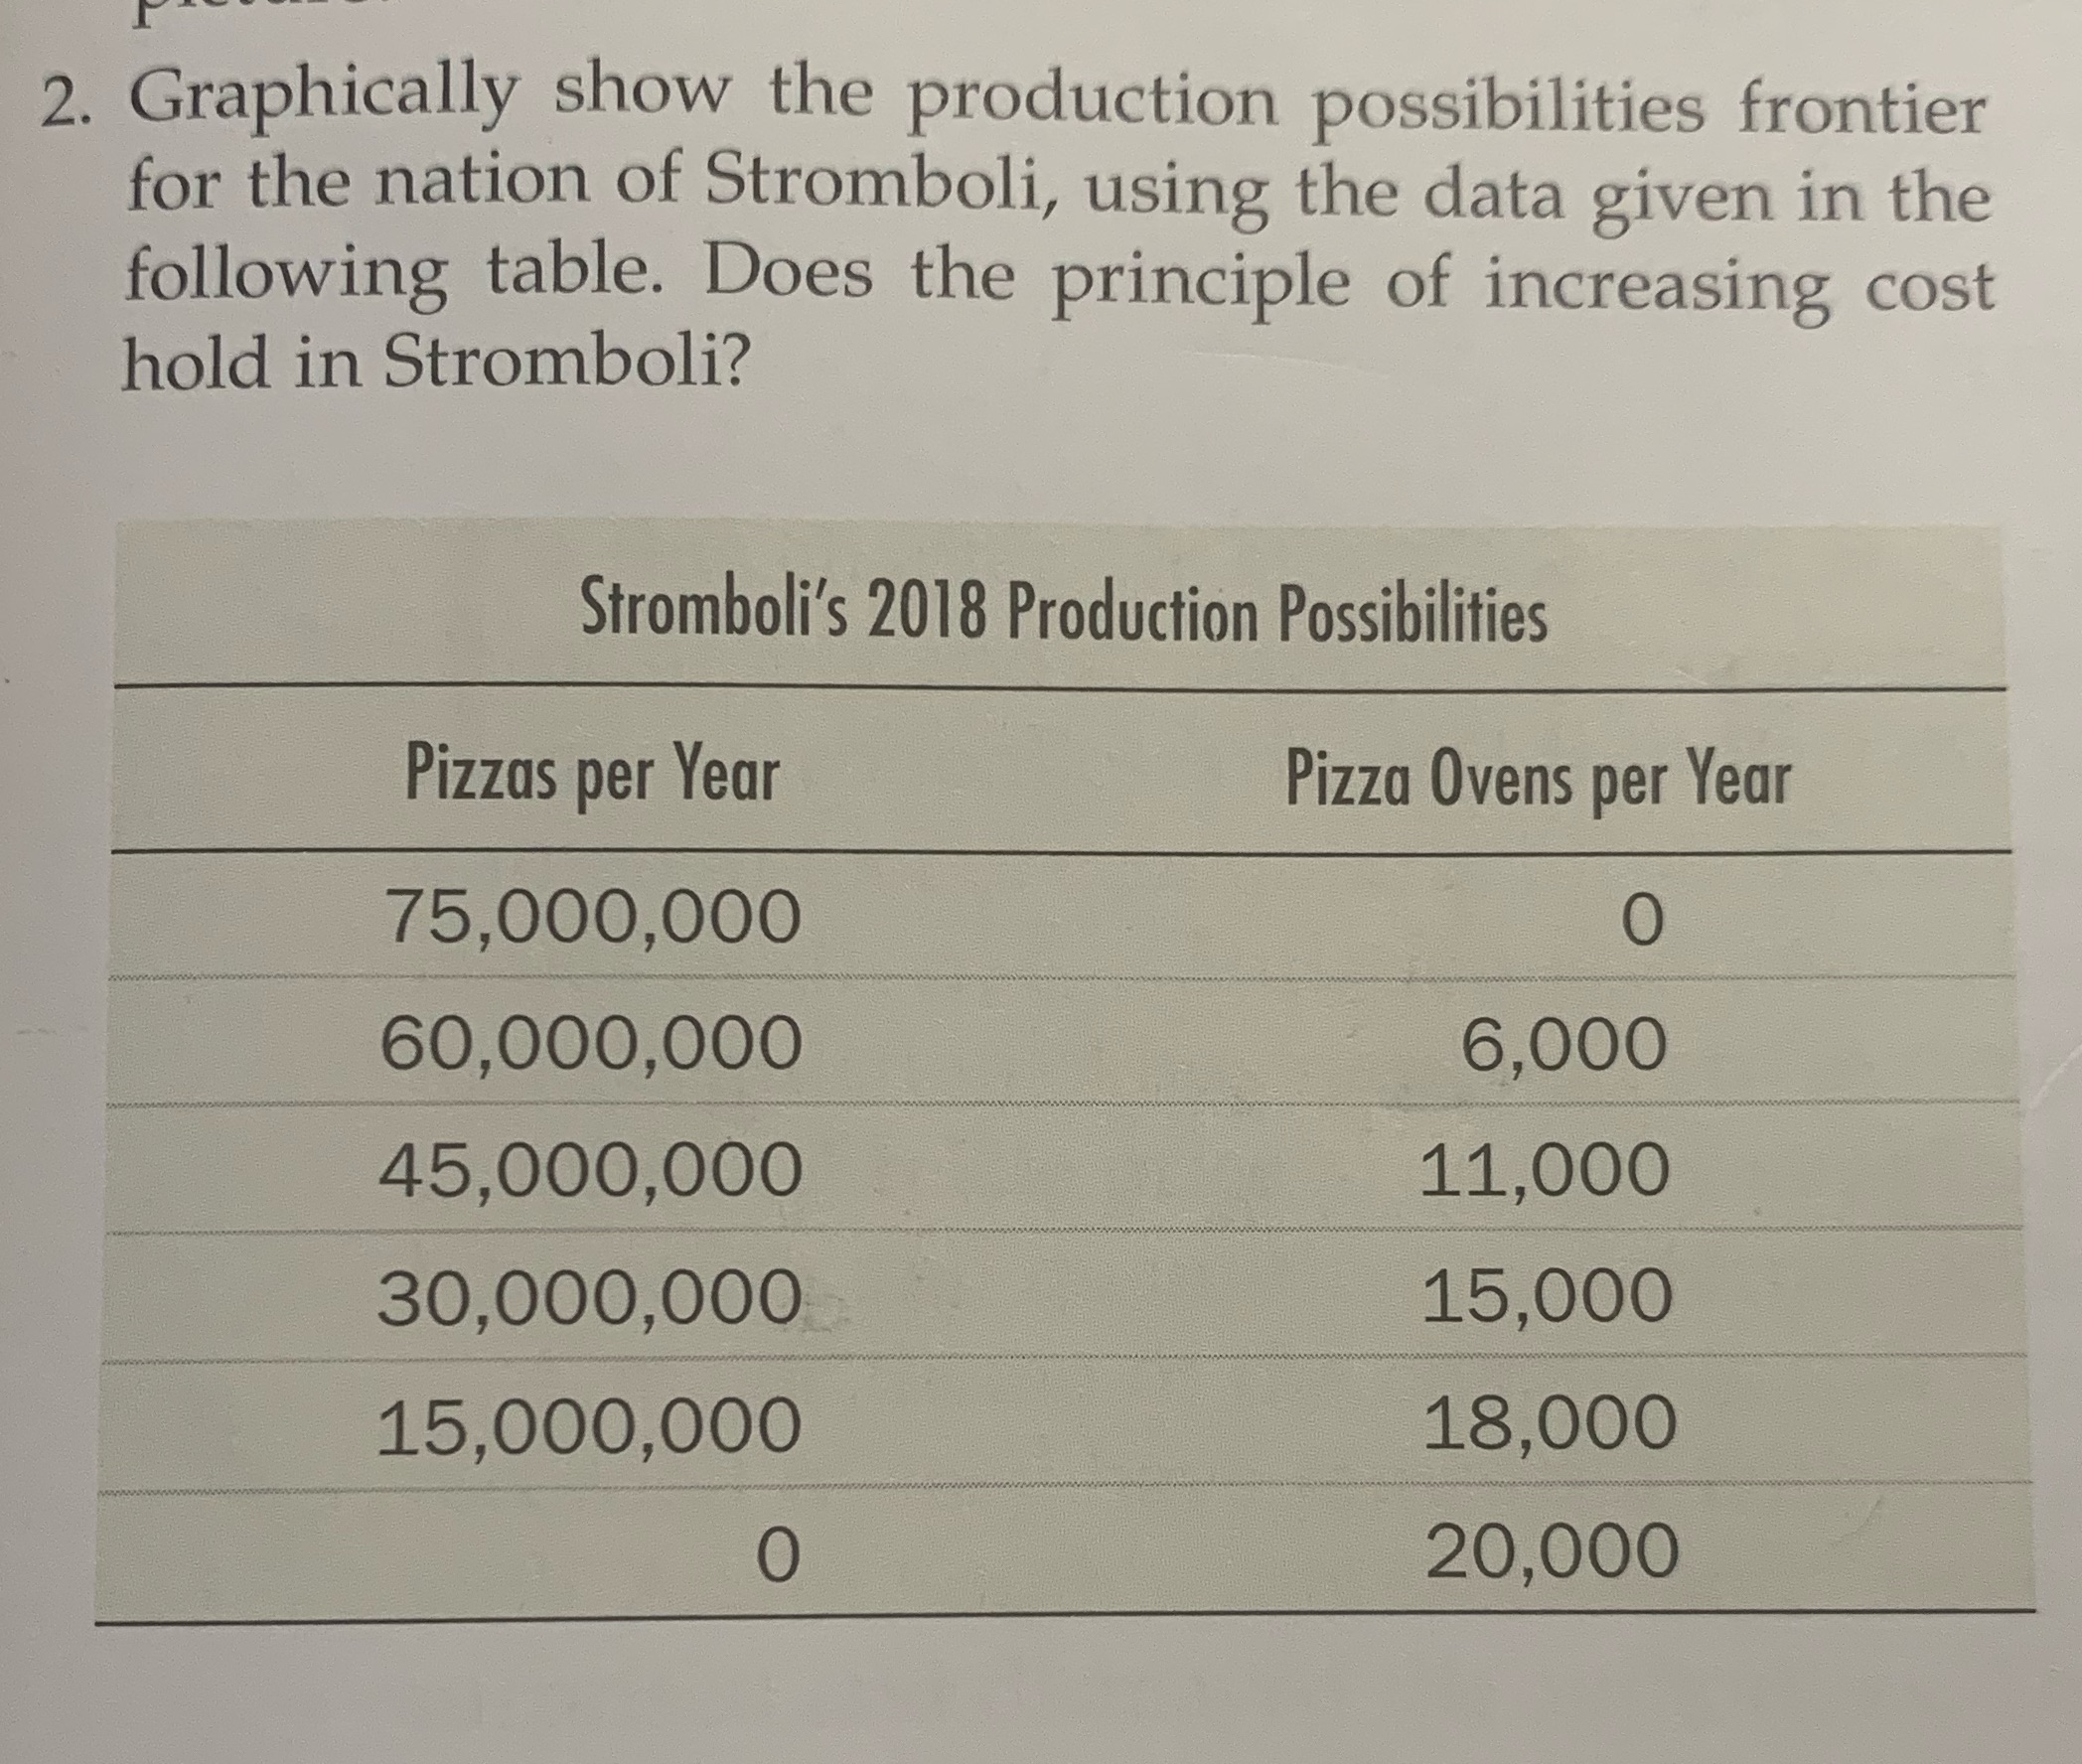
2. Graphically show the production possibilities frontier for the nation of Stromboli, using the data given in the following table. Does the principle of increasing cost hold in Stromboli? Stromboli's 2018 Production Possibilities Pizzas per Year Pizza Ovens per Year 75,000,000 0 60,000,000 6,000 45,000,000 11,000 30,000,000 15,000 15,000,000 18,000 0 20,000
Step by Step Solution
There are 3 Steps involved in it
1 Expert Approved Answer
Step: 1 Unlock

Question Has Been Solved by an Expert!
Get step-by-step solutions from verified subject matter experts
Step: 2 Unlock
Step: 3 Unlock