

Question: 2. Histograms and box plots were computed for three different variables. The following shows these histograms and box plots presented in random order. HistogramA Boxplot
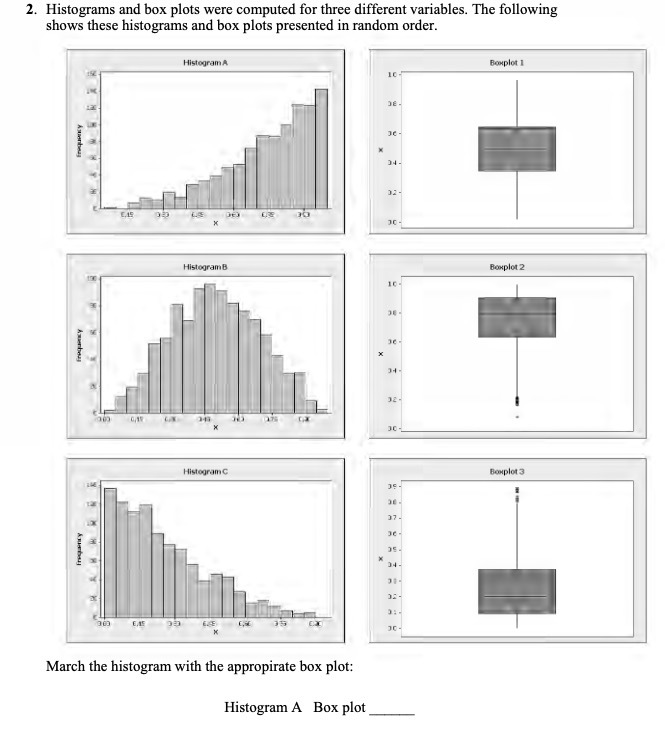
2. Histograms and box plots were computed for three different variables. The following shows these histograms and box plots presented in random order. HistogramA Boxplot 1 10 frequency 10- Histogram B Boxplot 2 12- Histogram C Boxplot 3 19 - 17. Freq Billy 04 - 10 - March the histogram with the appropirate box plot: Histogram A Box plot
Step by Step Solution
There are 3 Steps involved in it
1 Expert Approved Answer
Step: 1 Unlock

Question Has Been Solved by an Expert!
Get step-by-step solutions from verified subject matter experts
Step: 2 Unlock
Step: 3 Unlock