

Question: 2. Horizontal and Vertical Analyses Select income statement data for Baker Company for two recent years ended December 31 are as follows: 2012 20Y1 Sales
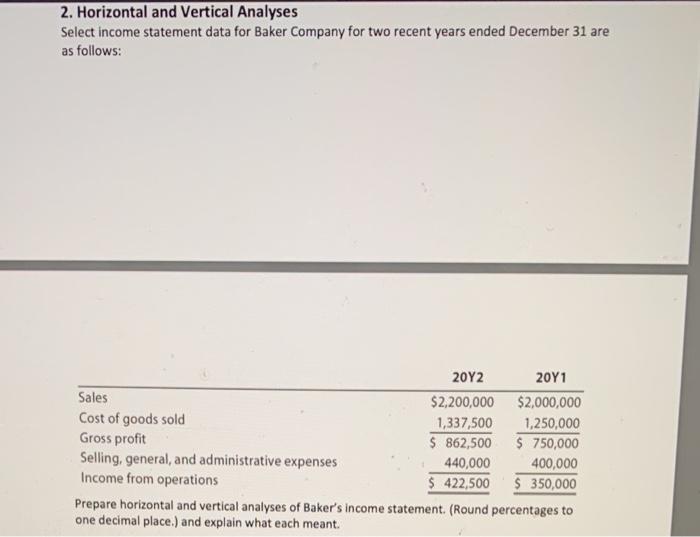
2. Horizontal and Vertical Analyses Select income statement data for Baker Company for two recent years ended December 31 are as follows: 2012 20Y1 Sales $2,200,000 $2,000,000 Cost of goods sold 1,337,500 1,250,000 Gross profit $ 862,500 $ 750,000 Selling, general, and administrative expenses 440,000 400,000 Income from operations $ 422,500 $ 350,000 Prepare horizontal and vertical analyses of Baker's income statement. (Round percentages to one decimal place.) and explain what each meant
Step by Step Solution
There are 3 Steps involved in it
1 Expert Approved Answer
Step: 1 Unlock

Question Has Been Solved by an Expert!
Get step-by-step solutions from verified subject matter experts
Step: 2 Unlock
Step: 3 Unlock