

Question: 2 id last digit is 2 Part IV-(10 Marks) Instructions: Based on the last digit of your student ID, take the following values of A,
2
id last digit is 2
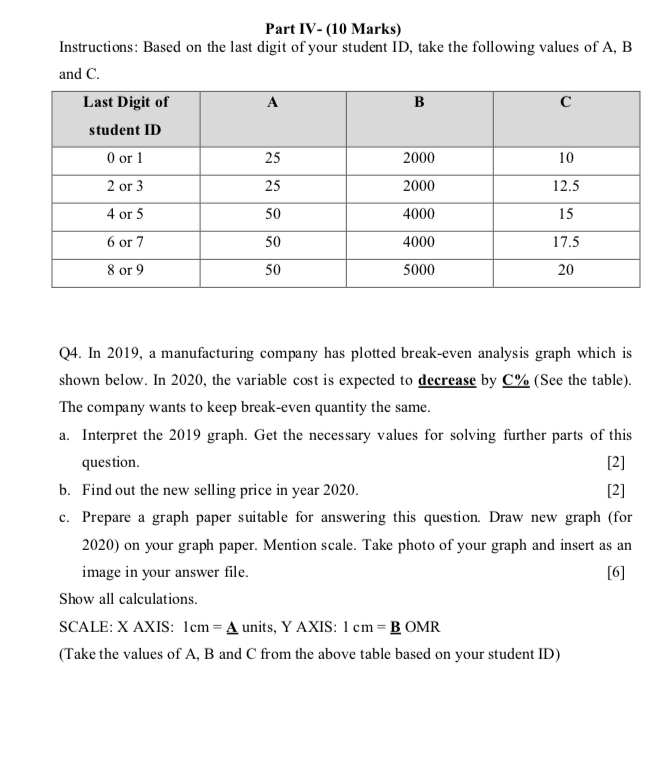
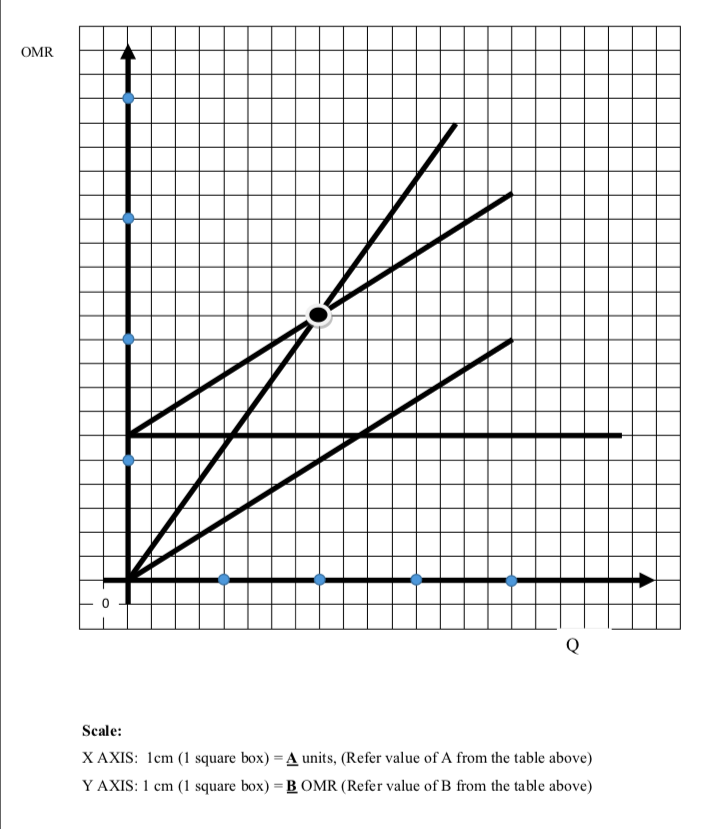
Part IV-(10 Marks) Instructions: Based on the last digit of your student ID, take the following values of A, B and C. Last Digit of A B student ID 0 or 1 25 2000 10 2 or 3 25 2000 12.5 4 or 5 50 4000 15 6 or 7 50 4000 17.5 8 or 9 50 5000 20 Q4. In 2019, a manufacturing company has plotted break-even analysis graph which is shown below. In 2020, the variable cost is expected to decrease by C% (See the table). The company wants to keep break-even quantity the same. a. Interpret the 2019 graph. Get the necessary values for solving further parts of this question. [2] b. Find out the new selling price in year 2020. [2] c. Prepare a graph paper suitable for answering this question. Draw new graph (for 2020) on your graph paper. Mention scale. Take photo of your graph and insert as an image in your answer file. Show all calculations. SCALE: X AXIS: 1cm= A units, Y AXIS: 1 cm= B OMR (Take the values of A, B and C from the above table based on your student ID) [6] OMR Scale: X AXIS: 1cm (1 square box) = A units, (Refer value of A from the table above) Y AXIS: 1 cm (1 square box)=B OMR (Refer value of B from the table above) Part IV-(10 Marks) Instructions: Based on the last digit of your student ID, take the following values of A, B and C. Last Digit of A B student ID 0 or 1 25 2000 10 2 or 3 25 2000 12.5 4 or 5 50 4000 15 6 or 7 50 4000 17.5 8 or 9 50 5000 20 Q4. In 2019, a manufacturing company has plotted break-even analysis graph which is shown below. In 2020, the variable cost is expected to decrease by C% (See the table). The company wants to keep break-even quantity the same. a. Interpret the 2019 graph. Get the necessary values for solving further parts of this question. [2] b. Find out the new selling price in year 2020. [2] c. Prepare a graph paper suitable for answering this question. Draw new graph (for 2020) on your graph paper. Mention scale. Take photo of your graph and insert as an image in your answer file. Show all calculations. SCALE: X AXIS: 1cm= A units, Y AXIS: 1 cm= B OMR (Take the values of A, B and C from the above table based on your student ID) [6] OMR Scale: X AXIS: 1cm (1 square box) = A units, (Refer value of A from the table above) Y AXIS: 1 cm (1 square box)=B OMR (Refer value of B from the table above)
Step by Step Solution
There are 3 Steps involved in it
1 Expert Approved Answer
Step: 1 Unlock

Question Has Been Solved by an Expert!
Get step-by-step solutions from verified subject matter experts
Step: 2 Unlock
Step: 3 Unlock