

Question: 2) In a diabetes study on 27,5 OOpatients, found that 13,425 had uncontrolled blood glucose level. The sample proportion of patients with uncontrolled blood glucose
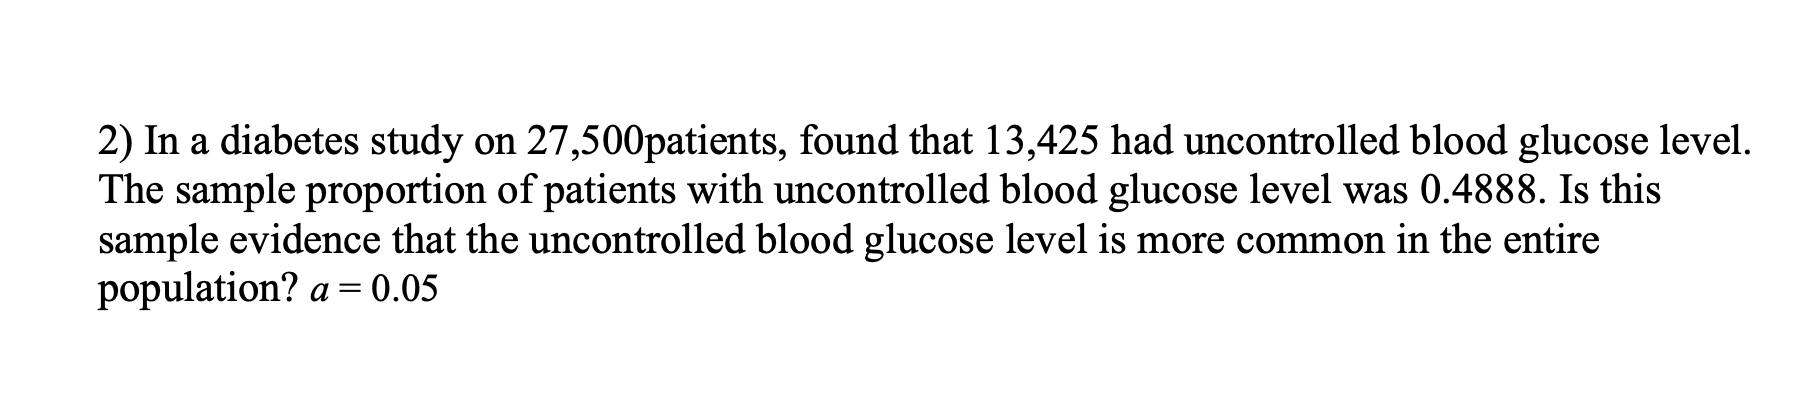

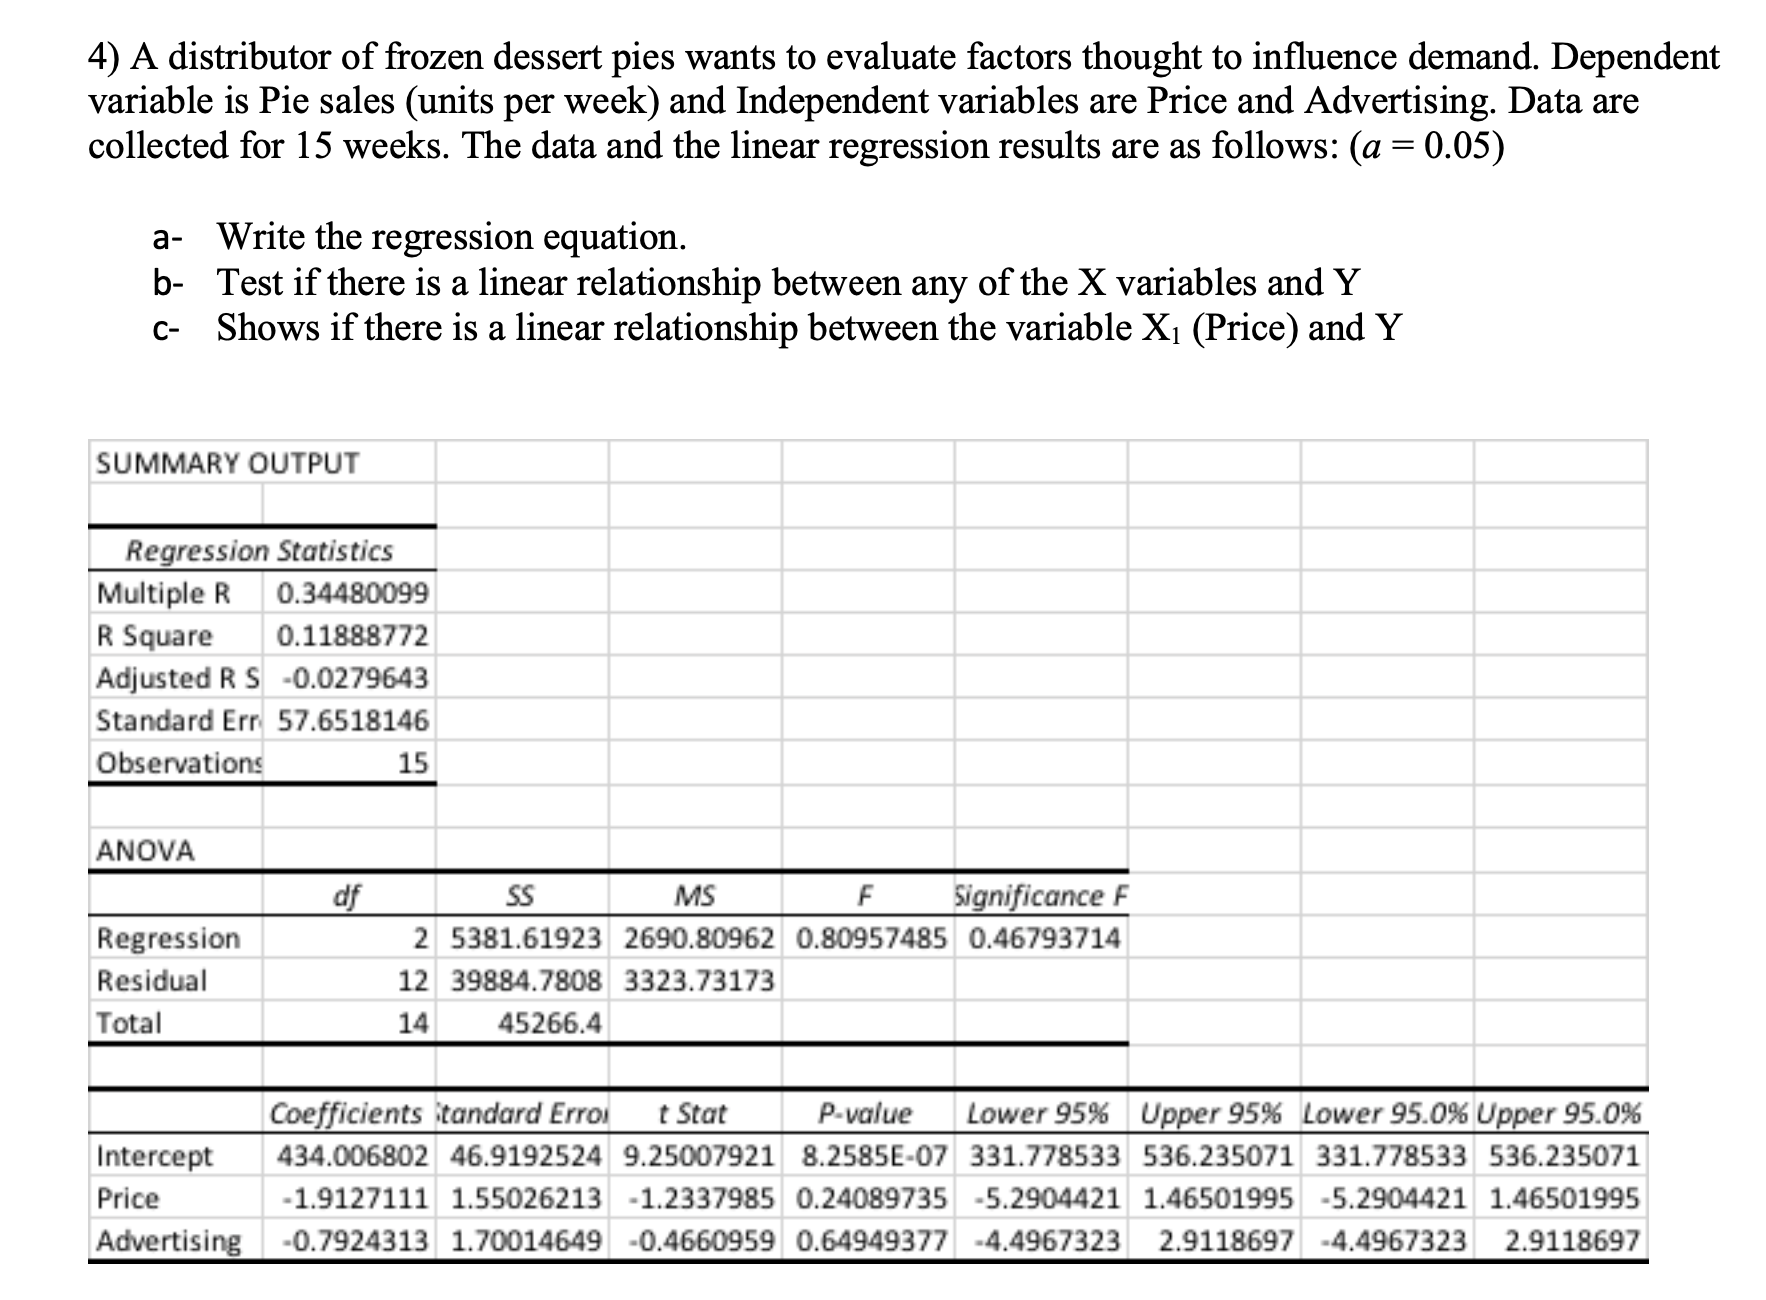
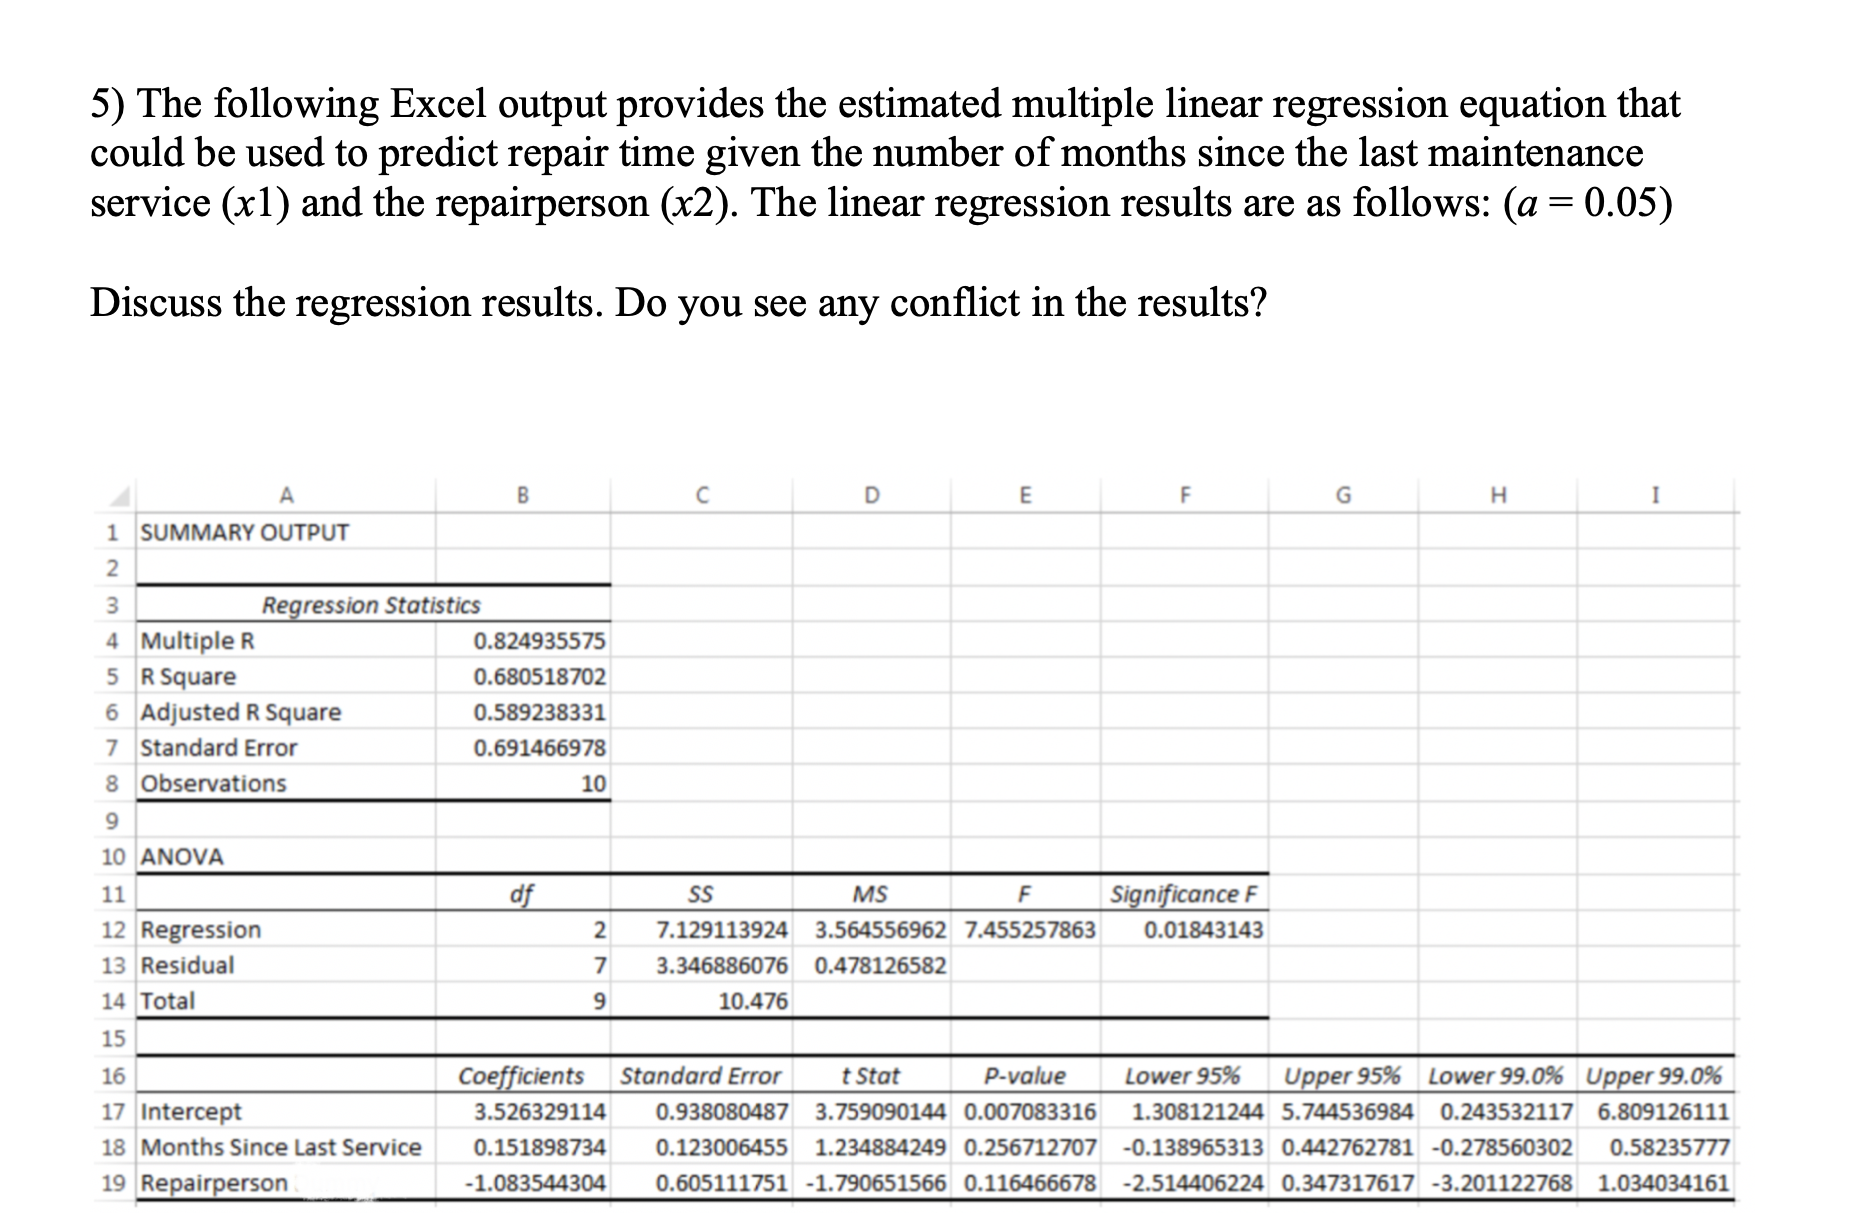


2) In a diabetes study on 27,5 OOpatients, found that 13,425 had uncontrolled blood glucose level. The sample proportion of patients with uncontrolled blood glucose level was 0.4888. Is this sample evidence that the uncontrolled blood glucose level is more common in the entire population? a = 0.05 3) The following is random sample of 18 people normal body temps. Test if the normal body temperature is actually 376C (on average)? a = 0.05 38.3 36.2 37.2 37.6 38.3 37.6 37.4 36.3 36.5 37.4 38.3 36 37.8 37.7 36.2 36.9 38.2 38.7 4) A distributor of frozen dessert pies wants to evaluate factors thought to influence demand. Dependent variable is Pie sales (units per week) and Independent variables are Price and Advertising. Data are collected for 15 weeks. The data and the linear regression results are as follows: (a = 0.05) a- Write the regression equation. b- Test if there is a linear relationship between any of the X variables and Y c- Shows if there is a linear relationship between the variable X1 (Price) and Y SUMMARY OUTPUT Regression Statistics Multiple R 0.34480099 R Square 0.11888772 Adjusted R S -0.0279643 Standard Err 57.6518146 Observations 15 ANOVA of SS MS F Significance F Regression 2 5381.61923 2690.80962 0.80957485 0.46793714 Residual 12 39884.7808 3323.73173 Total 14 45266.4 Coefficients Standard Error t Stat P-value Lower 95% Upper 95% Lower 95.0% Upper 95.0% Intercept 434.006802 46.9192524 9.25007921 8.2585E-07 331.778533 536.235071 331.778533 536.235071 Price -1.9127111 1.55026213 -1.2337985 0.24089735 -5.2904421 1.46501995 -5.2904421 1.46501995 Advertising -0.7924313 1.70014649 -0.4660959 0.64949377 -4.4967323 2.9118697 -4.4967323 2.91186975) The following Excel output provides the estimated multiple linear regression equation that could be used to predict repair time given the number of months since the last maintenance service (x1) and the repairperson (x2). The linear regression results are as follows: (a = 0.05) Discuss the regression results. Do you see any conflict in the results? A B C D E F G H I SUMMARY OUTPUT W NH Regression Statistics 4 Multiple R 0.824935575 5 R Square 0.680518702 6 Adjusted R Square 0.589238331 7 Standard Error 0.691466978 8 Observations 10 9 10 ANOVA 11 of SS MS F Significance F 12 Regression 2 7.129113924 3.564556962 7.455257863 0.01843143 13 Residual 3.346886076 0.478126582 14 Total 10.476 15 16 Coefficients Standard Error t Stat P-value Lower 95% Upper 95% Lower 99.0% Upper 99.0% 17 Intercept 3.526329114 0.938080487 3.759090144 0.007083316 1.308121244 5.744536984 0.243532117 6.809126111 18 Months Since Last Service 0.151898734 0.123006455 1.234884249 0.256712707 -0.138965313 0.442762781 -0.278560302 0.58235777 19 Repairperson -1.083544304 0.605111751 -1.790651566 0.116466678 -2.514406224 0.347317617 -3.201122768 1.034034161
Step by Step Solution
There are 3 Steps involved in it

Get step-by-step solutions from verified subject matter experts