

Question: 2. in the above figure, which path represents a cost-push inflation? LAS SAS2 130 SAS, 120 SASO 110 100 AD2 90 AD1 ADO 8.
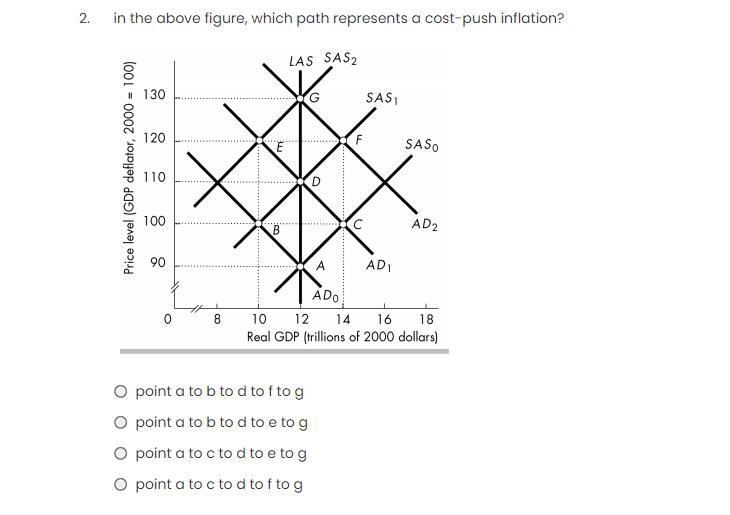
2. in the above figure, which path represents a cost-push inflation? LAS SAS2 130 SAS, 120 SASO 110 100 AD2 90 AD1 ADO 8. 10 12 14 16 18 Real GDP (trillions of 2000 dollars) O point a to b tod to f to g O point a to b to d to e to g O point a to c to d to e to g O point a to c to d to f to g Price level (GDP deflator, 2000 = 100) in
Step by Step Solution
★★★★★
3.58 Rating (165 Votes )
There are 3 Steps involved in it
1 Expert Approved Answer
Step: 1 Unlock

In the above figure one can observe the various rightward shifts in the demand curve and a leftward ... View full answer
Question Has Been Solved by an Expert!
Get step-by-step solutions from verified subject matter experts
Step: 2 Unlock
Step: 3 Unlock