

Question: 2. In this assignment we want to determine treasury zero rates and plot zero rates using a bootstrap method. Do following steps: (a) Look at
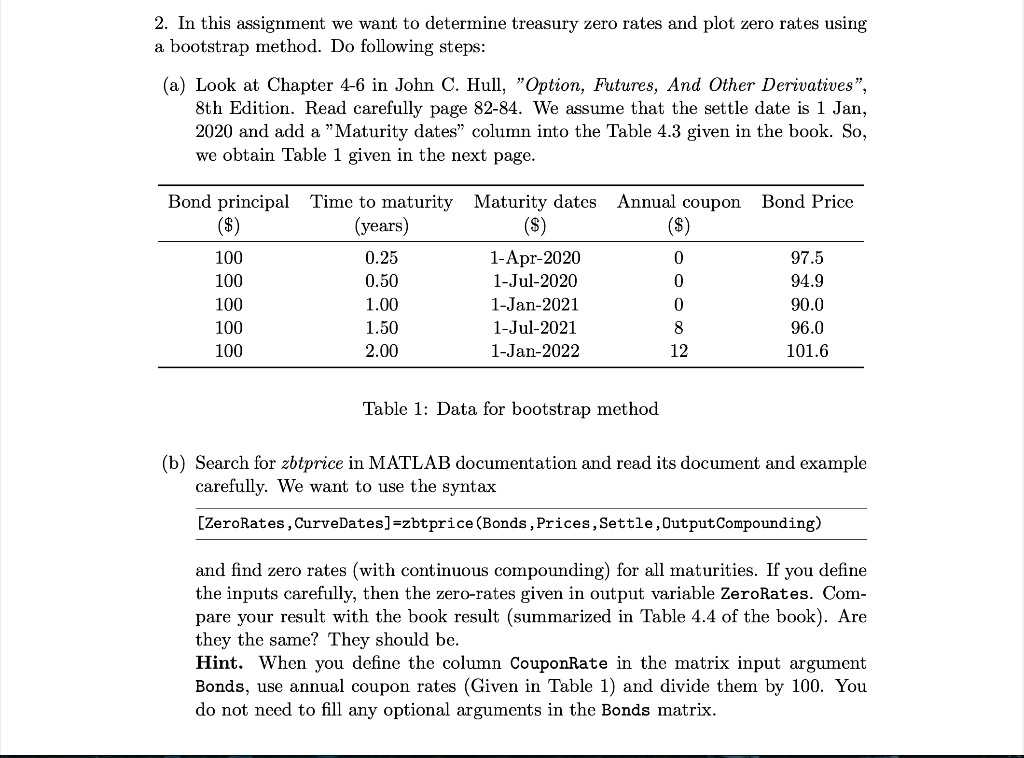
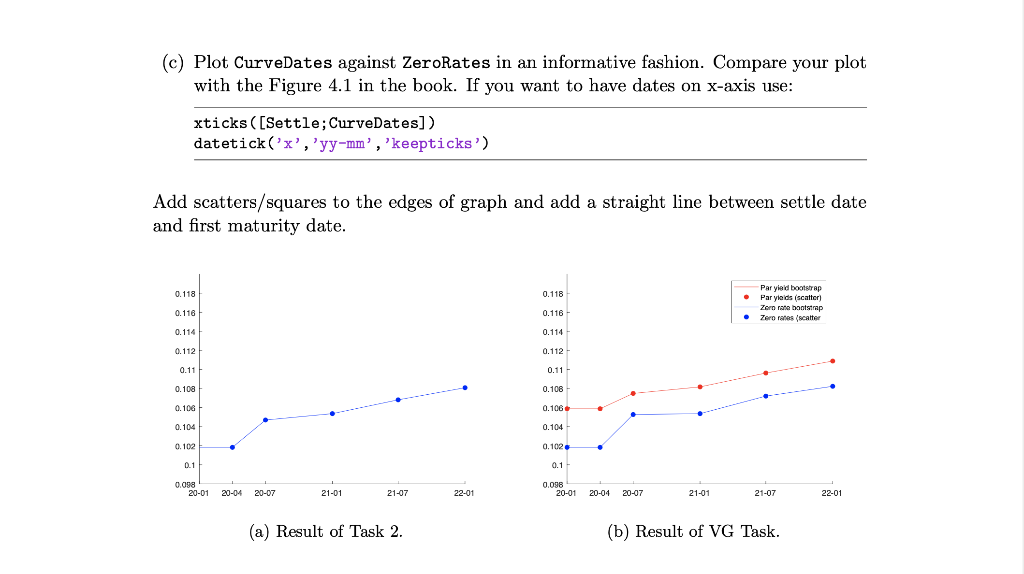
2. In this assignment we want to determine treasury zero rates and plot zero rates using a bootstrap method. Do following steps: (a) Look at Chapter 4-6 in John C. Hull, "Option, Futures, And Other Derivatives", 8th Edition. Read carefully page 82-84. We assume that the settle date is 1 Jan, 2020 and add a "Maturity dates column into the Table 4.3 given in the book. So, we obtain Table 1 given in the next page. Bond Price Annual coupon ($) Bond principal Time to maturity Maturity dates (years) ($) 100 0.25 1-Apr-2020 100 0.50 1-Jul-2020 100 1.00 1-Jan-2021 100 1.50 1-Jul-2021 100 2.00 1-Jan-2022 0 0 0 8 12 97.5 94.9 90.0 96.0 101.6 Table 1: Data for bootstrap method (b) Search for zbtprice in MATLAB documentation and read its document and example carefully. We want to use the syntax [ZeroRates, CurveDates]=zbtprice (Bonds , Prices, Settle, Output Compounding) and find zero rates (with continuous compounding) for all maturities. If you define the inputs carefully, then the zero-rates given in output variable ZeroRates. Com- pare your result with the book result (summarized in Table 4.4 of the book). Are they the same? They should be. Hint. When you define the column CouponRate in the matrix input argument Bonds, use annual coupon rates (Given in Table 1) and divide them by 100. You do not need to fill any optional arguments in the Bonds matrix. (c) Plot CurveDates against ZeroRates in an informative fashion. Compare your plot with the Figure 4.1 in the book. If you want to have dates on x-axis use: xticks ([Settle; CurveDates]) datetick('x','yy-mm', 'keepticks') Add scatters/squares to the edges of graph and add a straight line between settle date and first maturity date. 0.118 0.118 Par yield bootstrap Par yields scatter Zorn rate bootstrap . Zero rates (scatter 0.116 0.116 0.114 0.114 0.112 0.112 0.11 0.11 0.108 0.106 0.106 0.106 0.104 0.104 0.102 0.102 0.1 0.1 0.008 20-01 20-04 20-07 21-01 0.0980-01 20-04 21-07 22-01 20-07 21-01 21-07 22-01 (a) Result of Task 2. (b) Result of VG Task. 2. In this assignment we want to determine treasury zero rates and plot zero rates using a bootstrap method. Do following steps: (a) Look at Chapter 4-6 in John C. Hull, "Option, Futures, And Other Derivatives", 8th Edition. Read carefully page 82-84. We assume that the settle date is 1 Jan, 2020 and add a "Maturity dates column into the Table 4.3 given in the book. So, we obtain Table 1 given in the next page. Bond Price Annual coupon ($) Bond principal Time to maturity Maturity dates (years) ($) 100 0.25 1-Apr-2020 100 0.50 1-Jul-2020 100 1.00 1-Jan-2021 100 1.50 1-Jul-2021 100 2.00 1-Jan-2022 0 0 0 8 12 97.5 94.9 90.0 96.0 101.6 Table 1: Data for bootstrap method (b) Search for zbtprice in MATLAB documentation and read its document and example carefully. We want to use the syntax [ZeroRates, CurveDates]=zbtprice (Bonds , Prices, Settle, Output Compounding) and find zero rates (with continuous compounding) for all maturities. If you define the inputs carefully, then the zero-rates given in output variable ZeroRates. Com- pare your result with the book result (summarized in Table 4.4 of the book). Are they the same? They should be. Hint. When you define the column CouponRate in the matrix input argument Bonds, use annual coupon rates (Given in Table 1) and divide them by 100. You do not need to fill any optional arguments in the Bonds matrix. (c) Plot CurveDates against ZeroRates in an informative fashion. Compare your plot with the Figure 4.1 in the book. If you want to have dates on x-axis use: xticks ([Settle; CurveDates]) datetick('x','yy-mm', 'keepticks') Add scatters/squares to the edges of graph and add a straight line between settle date and first maturity date. 0.118 0.118 Par yield bootstrap Par yields scatter Zorn rate bootstrap . Zero rates (scatter 0.116 0.116 0.114 0.114 0.112 0.112 0.11 0.11 0.108 0.106 0.106 0.106 0.104 0.104 0.102 0.102 0.1 0.1 0.008 20-01 20-04 20-07 21-01 0.0980-01 20-04 21-07 22-01 20-07 21-01 21-07 22-01 (a) Result of Task 2. (b) Result of VG Task
Step by Step Solution
There are 3 Steps involved in it

Get step-by-step solutions from verified subject matter experts