

Question: 2. Inputs and outputs Kyoko's Performance Pizza is a small restaurant in Denver that sells gluten-free pizzas. Kyoko's very tiny kitchen has barely enough
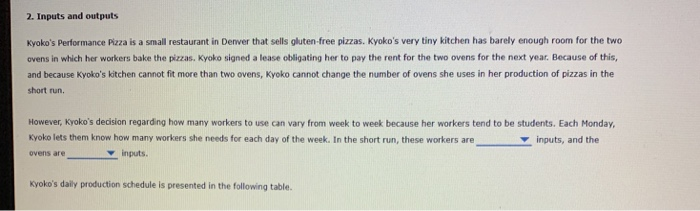
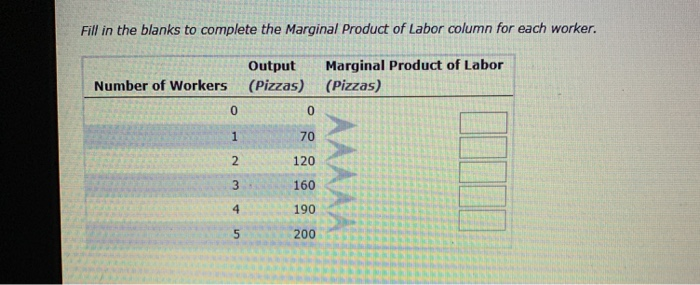
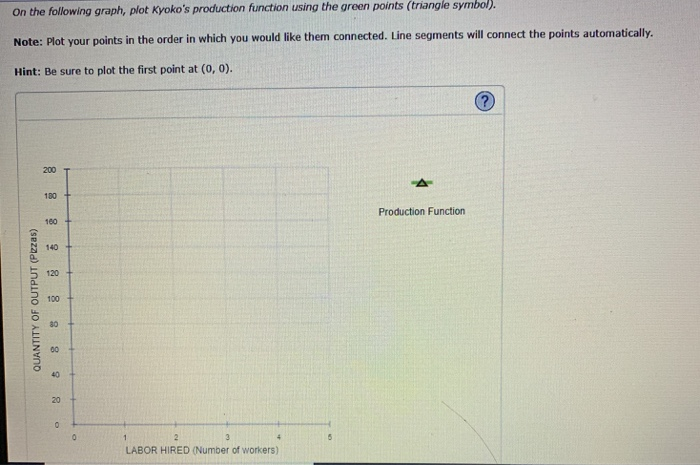
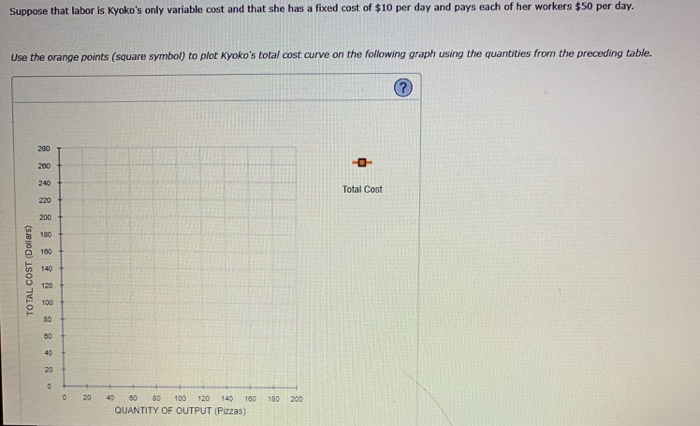
2. Inputs and outputs Kyoko's Performance Pizza is a small restaurant in Denver that sells gluten-free pizzas. Kyoko's very tiny kitchen has barely enough room for the two ovens in which her workers bake the pizzas. Kyoko signed a lease obligating her to pay the rent for the two ovens for the next year. Because of this, and because Kyoko's kitchen cannot fit more than two ovens, Kyoko cannot change the number of ovens she uses in her production of pizzas in the short run. However, Kyoko's decision regarding how many workers to use can vary from week to week because her workers tend to be students. Each Monday, Kyoko lets them know how many workers she needs for each day of the week. In the short run, these workers are inputs, and the ovens are inputs. Kyoko's daily production schedule is presented in the following table. Fill in the blanks to complete the Marginal Product of Labor column for each worker. Output Marginal Product of Labor (Pizzas) (Pizzas) Number of Workers 0 1 2 3 45 0 70 120 160 190 200 AAAAA On the following graph, plot Kyoko's production function using the green points (triangle symbol). Note: Plot your points in the order in which you would like them connected. Line segments will connect the points automatically. Hint: Be sure to plot the first point at (0, 0). QUANTITY OF OUTPUT (Pizzas) 200 100 160 140 120 100 80 00 40 20 O 0 2 LABOR HIRED (Number of workers) 4 Production Function Suppose that labor is Kyoko's only variable cost and that she has a fixed cost of $10 per day and pays each of her workers $50 per day. Use the orange points (square symbol) to plot Kyoko's total cost curve on the following graph using the quantities from the preceding table. TOTAL COST (Dollars) 2 8 2 8 2 2 2 2 2 2 2 2 2 20 280 200 240 200 180 160 140 120 100 60 40 0 20 40 60 80 100 120 140 100 180 200 QUANTITY OF OUTPUT (Pizzas) ---- Total Cost True or False: The shape of the production function reflects the law of diminishing marginal returns. True False 2. Inputs and outputs Kyoko's Performance Pizza is a small restaurant in Denver that sells gluten-free pizzas. Kyoko's very tiny kitchen has barely enough room for the two ovens in which her workers bake the pizzas. Kyoko signed a lease obligating her to pay the rent for the two ovens for the next year. Because of this, and because Kyoko's kitchen cannot fit more than two ovens, Kyoko cannot change the number of ovens she uses in her production of pizzas in the short run. However, Kyoko's decision regarding how many workers to use can vary from week to week because her workers tend to be students. Each Monday, Kyoko lets them know how many workers she needs for each day of the week. In the short run, these workers are inputs, and the ovens are inputs. Kyoko's daily production schedule is presented in the following table. Fill in the blanks to complete the Marginal Product of Labor column for each worker. Output Marginal Product of Labor (Pizzas) (Pizzas) Number of Workers 0 1 2 3 45 0 70 120 160 190 200 AAAAA On the following graph, plot Kyoko's production function using the green points (triangle symbol). Note: Plot your points in the order in which you would like them connected. Line segments will connect the points automatically. Hint: Be sure to plot the first point at (0, 0). QUANTITY OF OUTPUT (Pizzas) 200 100 160 140 120 100 80 00 40 20 O 0 2 LABOR HIRED (Number of workers) 4 Production Function Suppose that labor is Kyoko's only variable cost and that she has a fixed cost of $10 per day and pays each of her workers $50 per day. Use the orange points (square symbol) to plot Kyoko's total cost curve on the following graph using the quantities from the preceding table. TOTAL COST (Dollars) 2 8 2 8 2 2 2 2 2 2 2 2 2 20 280 200 240 200 180 160 140 120 100 60 40 0 20 40 60 80 100 120 140 100 180 200 QUANTITY OF OUTPUT (Pizzas) ---- Total Cost True or False: The shape of the production function reflects the law of diminishing marginal returns. True False 2. Inputs and outputs Kyoko's Performance Pizza is a small restaurant in Denver that sells gluten-free pizzas. Kyoko's very tiny kitchen has barely enough room for the two ovens in which her workers bake the pizzas. Kyoko signed a lease obligating her to pay the rent for the two ovens for the next year. Because of this, and because Kyoko's kitchen cannot fit more than two ovens, Kyoko cannot change the number of ovens she uses in her production of pizzas in the short run. However, Kyoko's decision regarding how many workers to use can vary from week to week because her workers tend to be students. Each Monday, Kyoko lets them know how many workers she needs for each day of the week. In the short run, these workers are inputs, and the ovens are inputs. Kyoko's daily production schedule is presented in the following table. Fill in the blanks to complete the Marginal Product of Labor column for each worker. Output Marginal Product of Labor (Pizzas) (Pizzas) Number of Workers 0 1 2 3 45 0 70 120 160 190 200 AAAAA On the following graph, plot Kyoko's production function using the green points (triangle symbol). Note: Plot your points in the order in which you would like them connected. Line segments will connect the points automatically. Hint: Be sure to plot the first point at (0, 0). QUANTITY OF OUTPUT (Pizzas) 200 100 160 140 120 100 80 00 40 20 O 0 2 LABOR HIRED (Number of workers) 4 Production Function Suppose that labor is Kyoko's only variable cost and that she has a fixed cost of $10 per day and pays each of her workers $50 per day. Use the orange points (square symbol) to plot Kyoko's total cost curve on the following graph using the quantities from the preceding table. TOTAL COST (Dollars) 2 8 2 8 2 2 2 2 2 2 2 2 2 20 280 200 240 200 180 160 140 120 100 60 40 0 20 40 60 80 100 120 140 100 180 200 QUANTITY OF OUTPUT (Pizzas) ---- Total Cost True or False: The shape of the production function reflects the law of diminishing marginal returns. True False 2. Inputs and outputs Kyoko's Performance Pizza is a small restaurant in Denver that sells gluten-free pizzas. Kyoko's very tiny kitchen has barely enough room for the two ovens in which her workers bake the pizzas. Kyoko signed a lease obligating her to pay the rent for the two ovens for the next year. Because of this, and because Kyoko's kitchen cannot fit more than two ovens, Kyoko cannot change the number of ovens she uses in her production of pizzas in the short run. However, Kyoko's decision regarding how many workers to use can vary from week to week because her workers tend to be students. Each Monday, Kyoko lets them know how many workers she needs for each day of the week. In the short run, these workers are inputs, and the ovens are inputs. Kyoko's daily production schedule is presented in the following table. Fill in the blanks to complete the Marginal Product of Labor column for each worker. Output Marginal Product of Labor (Pizzas) (Pizzas) Number of Workers 0 1 2 3 45 0 70 120 160 190 200 AAAAA On the following graph, plot Kyoko's production function using the green points (triangle symbol). Note: Plot your points in the order in which you would like them connected. Line segments will connect the points automatically. Hint: Be sure to plot the first point at (0, 0). QUANTITY OF OUTPUT (Pizzas) 200 100 160 140 120 100 80 00 40 20 O 0 2 LABOR HIRED (Number of workers) 4 Production Function Suppose that labor is Kyoko's only variable cost and that she has a fixed cost of $10 per day and pays each of her workers $50 per day. Use the orange points (square symbol) to plot Kyoko's total cost curve on the following graph using the quantities from the preceding table. TOTAL COST (Dollars) 2 8 2 8 2 2 2 2 2 2 2 2 2 20 280 200 240 200 180 160 140 120 100 60 40 0 20 40 60 80 100 120 140 100 180 200 QUANTITY OF OUTPUT (Pizzas) ---- Total Cost True or False: The shape of the production function reflects the law of diminishing marginal returns. True False
Step by Step Solution
3.44 Rating (147 Votes )
There are 3 Steps involved in it
ANSWER These employees are a VARIABLE input but the ovens are a FIXED input in the near term In cont... View full answer

Get step-by-step solutions from verified subject matter experts