

Question: 2. IS-LM-FX [10 points] Use the combined (side-by-side) IS-LM-FX diagram to answer this question. Clearly label the figures: axes, equilibrium points, levels of variables. Explain
![2. IS-LM-FX [10 points] Use the combined (side-by-side) IS-LM-FX diagram to](https://s3.amazonaws.com/si.experts.images/answers/2024/06/66758a199a5ff_09766758a196f760.jpg)
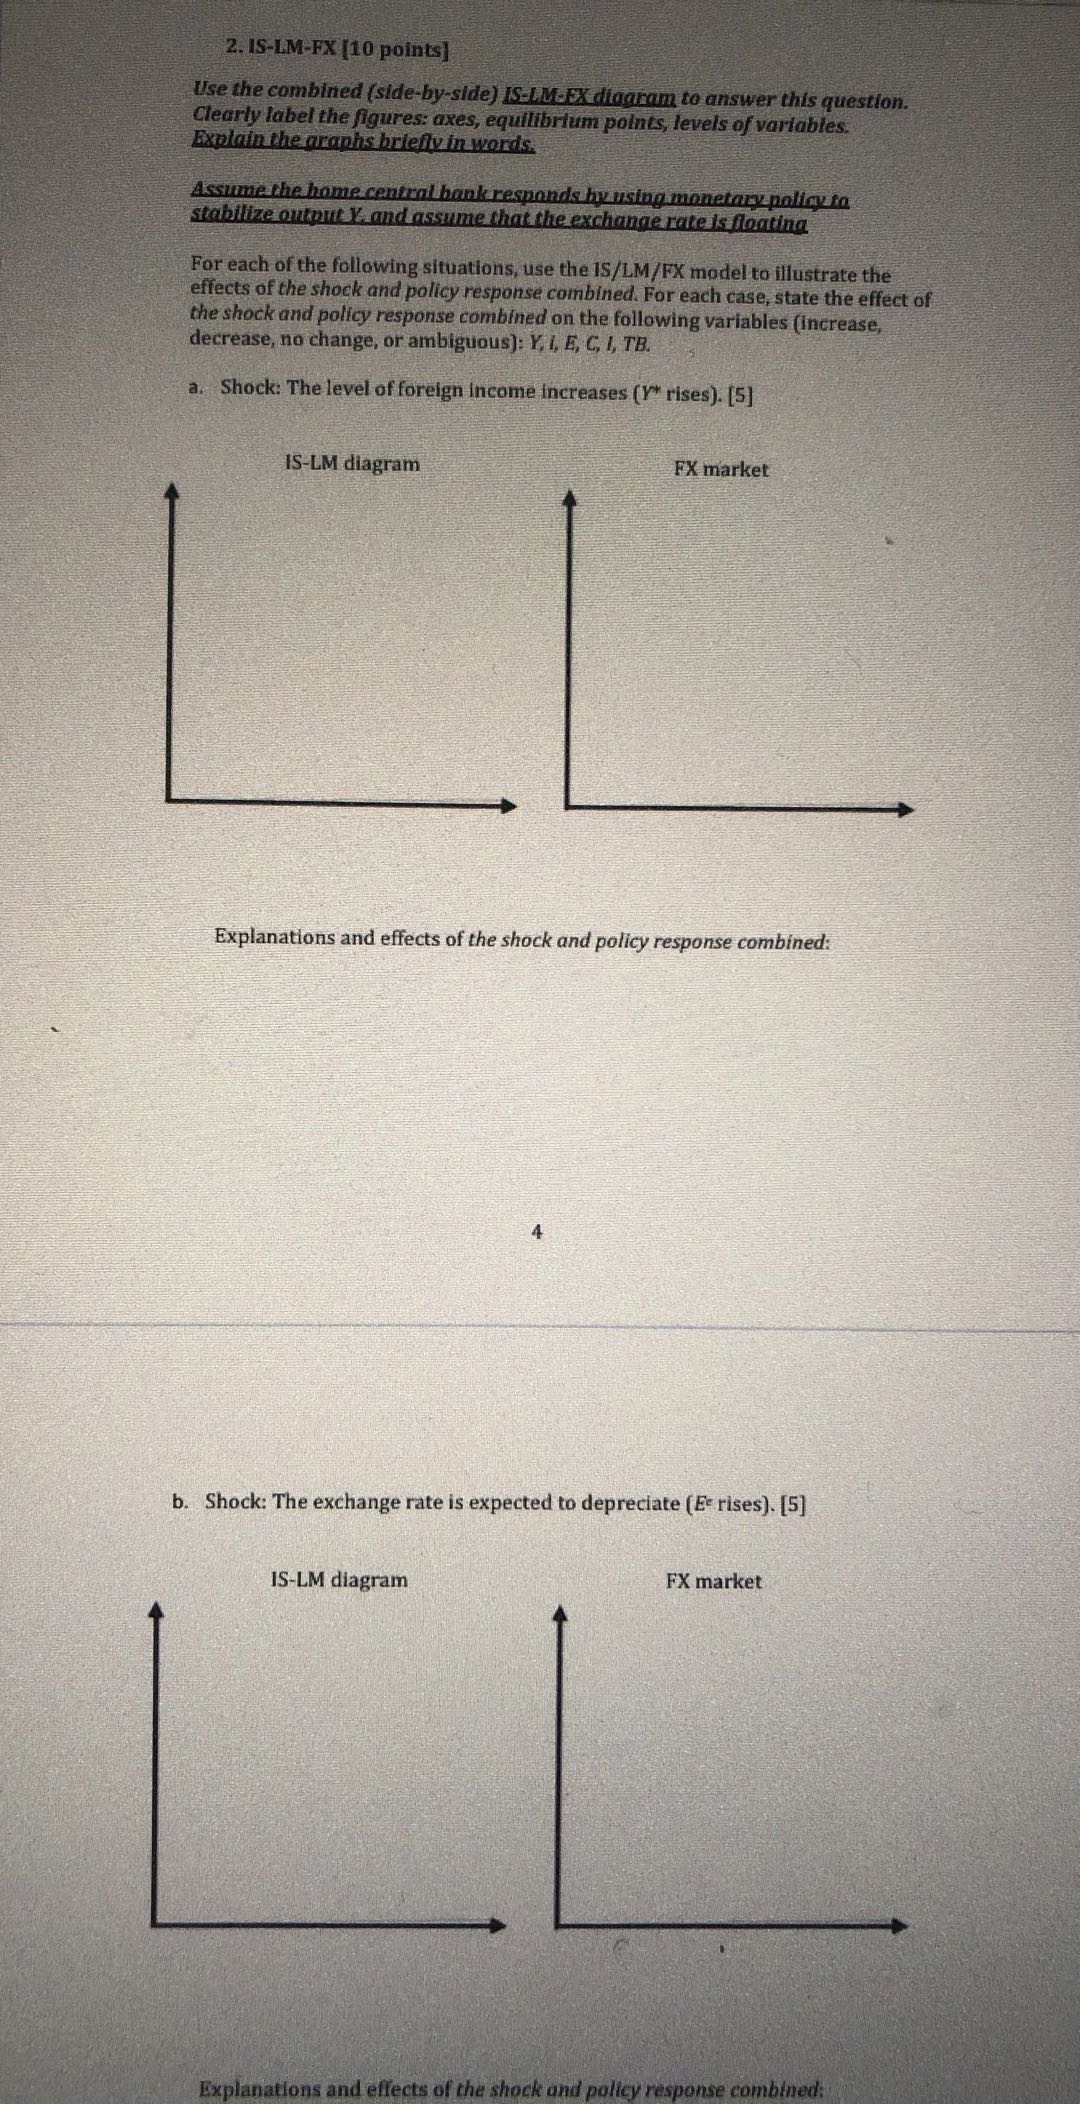
2. IS-LM-FX [10 points] Use the combined (side-by-side) IS-LM-FX diagram to answer this question. Clearly label the figures: axes, equilibrium points, levels of variables. Explain the graphs briefly in words. Assume the home central bank responds by using monetary policy fo stabilize output Y. and assume that the exchange rate is floating For each of the following situations, use the IS/LM/FX model to illustrate the effects of the shock and policy response combined. For each case, state the effect of the shock and policy response combined on the following variables (increase, decrease, no change, or ambiguous]: Y. I, E, C, I, TB. a. Shock: The level of foreign income increases (Y* rises). [5] IS-LM diagram FX market Explanations and effects of the shock and policy response combined: b. Shock: The exchange rate is expected to depreciate (Be rises). [5] IS-LM diagram FX market Explanations and effects of the shock and policy response combined
Step by Step Solution
There are 3 Steps involved in it

Get step-by-step solutions from verified subject matter experts