

Question: 2 Listen Based on the following chart: What is the probability of sales of 140? Sales Cum Prob In January Freq (Days) Prob 0 100
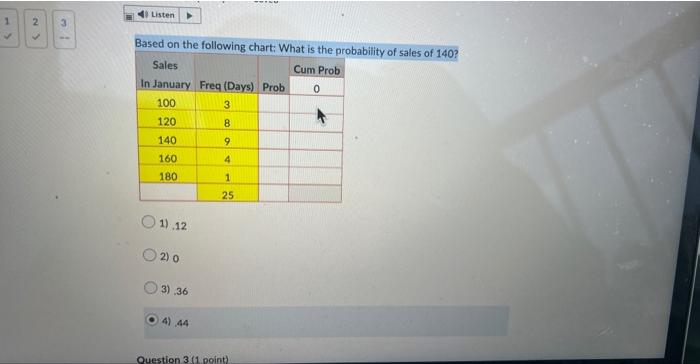
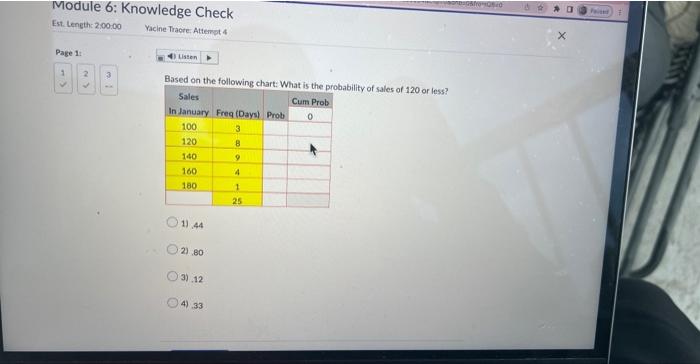
2 Listen Based on the following chart: What is the probability of sales of 140? Sales Cum Prob In January Freq (Days) Prob 0 100 120 140 160 180 1).12 2) 0 3).36 4) 44 3 8 9 4 1 25 Question 3 (1 point) Module 6: Knowledge Check Est. Length: 2:00:00 Yacine Traore Attempt 4 Page 1: 4 Based on the following chart: What is the probability of sales of 120 or less? Sales Cum Prob In January Freq (Days) Prob 0 100 120 140 160 180 O Listen O O 11 44 21,80 3) 12 4) 33 3 8 9 4 1 25 from
Step by Step Solution
There are 3 Steps involved in it
1 Expert Approved Answer
Step: 1 Unlock

Question Has Been Solved by an Expert!
Get step-by-step solutions from verified subject matter experts
Step: 2 Unlock
Step: 3 Unlock