

Question: 2. Lockheed has a standard deviation of 13% and Intel has a standard deviation of 9%. The correlation (p) between Lockheed and Intel is 0.
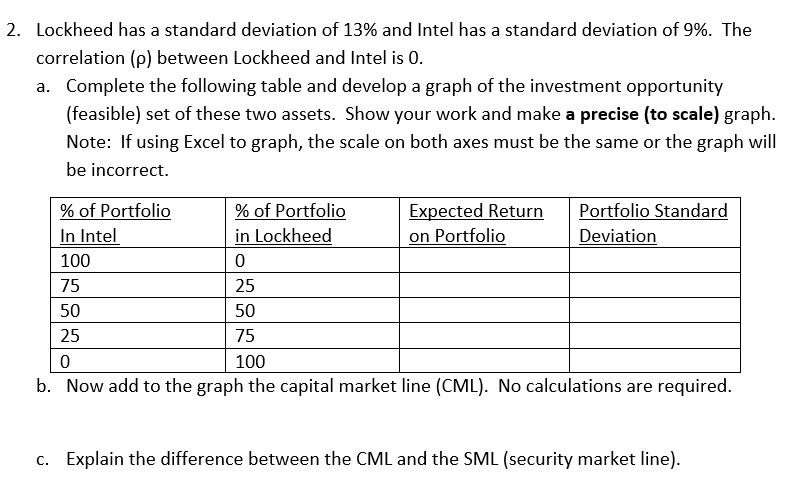
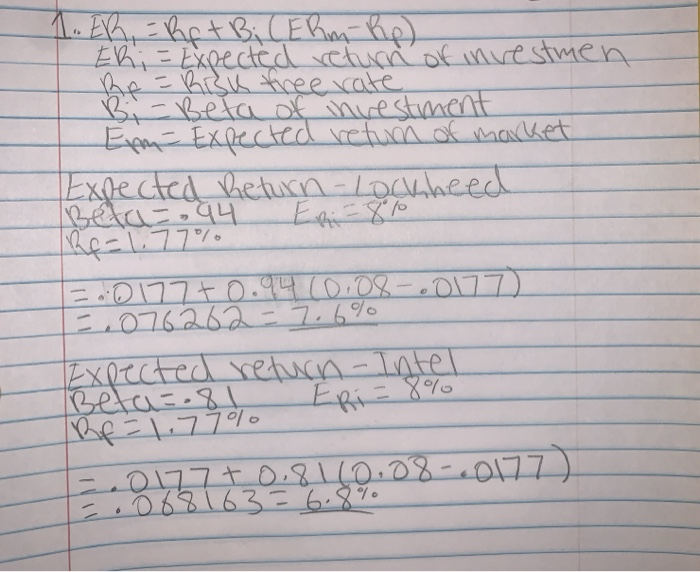
2. Lockheed has a standard deviation of 13% and Intel has a standard deviation of 9%. The correlation (p) between Lockheed and Intel is 0. a. Complete the following table and develop a graph of the investment opportunity (feasible) set of these two assets. Show your work and make a precise (to scale) graph. Note: If using Excel to graph, the scale on both axes must be the same or the graph will be incorrect. 75 % of Portfolio % of Portfolio Expected Return Portfolio Standard In Intel in Lockheed on Portfolio Deviation 100 25 50 25 100 b. Now add to the graph the capital market line (CML). No calculations are required. 50 75 C. Explain the difference between the CML and the SML (security market line). . ER, = Rpt Bi (Ehm Rp) Eni = Expected return of investmen Rp = Risk tree rate Bi-Beta of investment Em Expected retum of market Expected Return - Lockheed 2.0177 +0.94 0.08 . = 076262=7.6% Expected return Inte Beta=. 81 - 8% Rf = 1.77% 0177+0. 81 10.08-00177 088163 = 6.8
Step by Step Solution
There are 3 Steps involved in it

Get step-by-step solutions from verified subject matter experts