

Question: 2. Make two plots: the volatility smiles for puts and calls on Google (GOOG) and compare to 64. (a) For Google (GOOG), use the CBOE
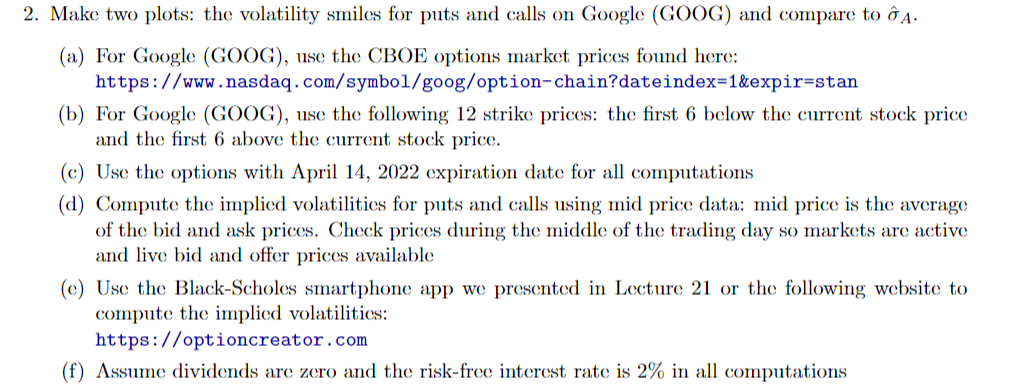
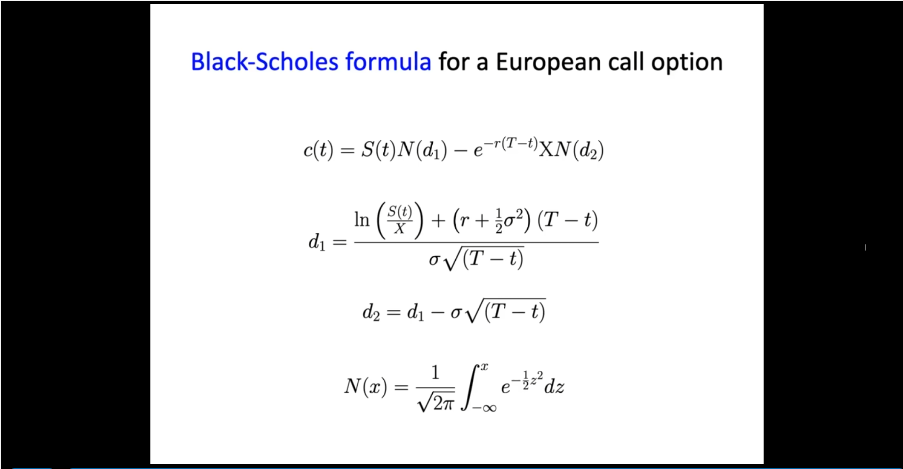
2. Make two plots: the volatility smiles for puts and calls on Google (GOOG) and compare to 64. (a) For Google (GOOG), use the CBOE options market prices found here: https://www. nasdaq. com/symbol/googoption-chain?dateindex=1&expir=stan (b) For Google (GOOG), use the following 12 strike prices: the first 6 below the current stock price and the first 6 above the current stock price. (c) Use the options with April 14, 2022 expiration date for all computations (d) Compute the implied volatilities for puts and calls using mid price data: mid price is the average of the bid and ask prices. Check prices during the middle of the trading day so markets are active and live bid and offer prices available (e) Use the Black-Scholes smartphone app we presented in Lecture 21 or the following website to compute the implied volatilities: https://optioncreator . com (f) Assume dividends are zero and the risk-free interest rate is 2% in all computationsBlack-Scholes formula for a European call option c(t) = S(t)N(di) - er(T-t)XN(d2) In S(t) X + (r+ ;02) (T-t) di = ov(T -t) d2 = d1 -ov(T -t) N(x) = e 2 dz V27T
Step by Step Solution
There are 3 Steps involved in it

Get step-by-step solutions from verified subject matter experts