

Question: (2 marks) Using the mean RT data for visual, auditory, visual+auditory stimuli in Lab1, calculate the correlation coefficients for the RT between all three pairs
(2 marks) Using the mean RT data for visual, auditory, visual+auditory stimuli in Lab1, calculate the correlation coefficients for the RT between all three pairs of stimuliusing Excel (1.5 marks). This should use the mean RTS for three conditions foryour entire lab (so a N of at least 15 participants, that your TA will provide). What isthe critical value necessary to determine if each of the correlation coefficient issignificant (0.5 mark).
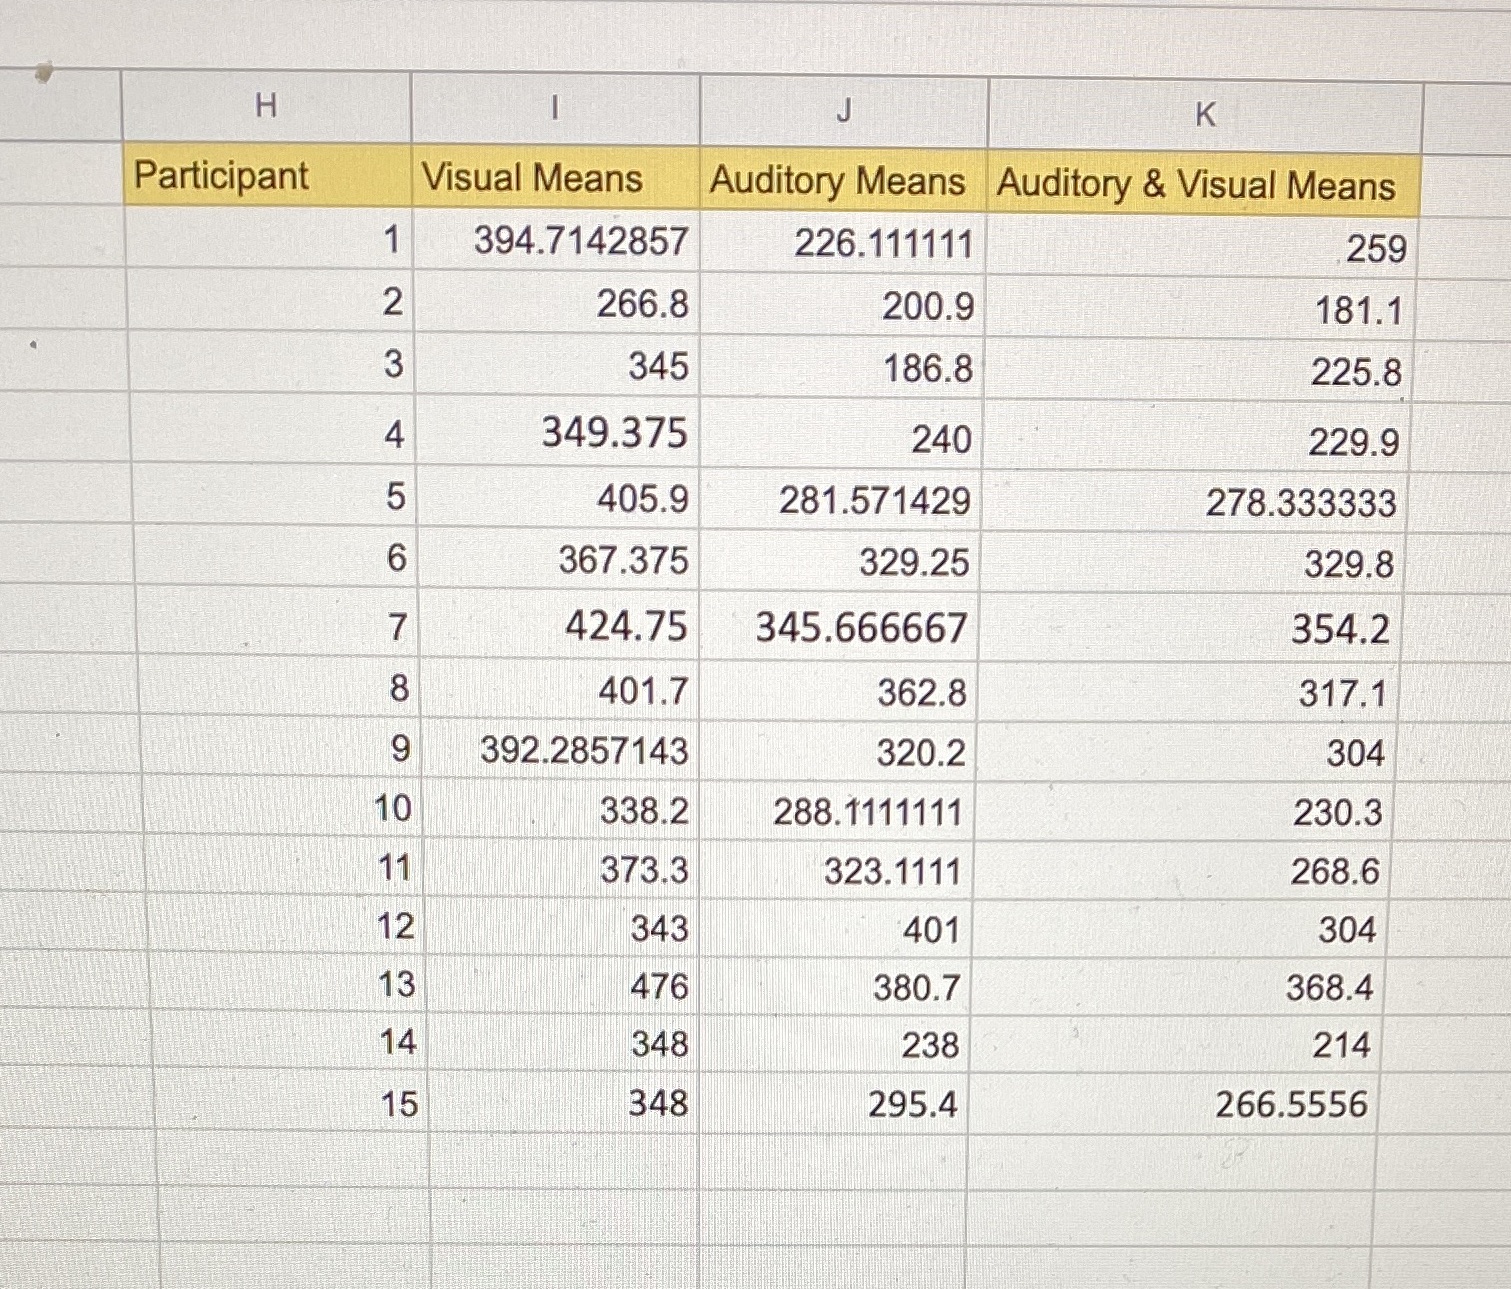
H K Participant Visual Means Auditory Means Auditory & Visual Means 394.7142857 226.111111 259 2 266.8 200.9 181.1 3 345 186.8 225.8 4 349.375 240 229.9 5 405.9 281.571429 278.333333 6 367.375 329.25 329.8 424.75 345.666667 354.2 8 401.7 362.8 317.1 9 392.2857143 320.2 304 10 338.2 288.1111111 230.3 11 373.3 323. 1111 268.6 12 343 401 304 13 476 380.7 368.4 14 348 238 214 15 348 295.4 266.5556
Step by Step Solution
There are 3 Steps involved in it

Get step-by-step solutions from verified subject matter experts