

Question: 2. Modeling the data: a. Generate linear, logarithmic, and exponential models. Output one model on each grap h. I]. When generating the least squares models
![Output one model on each grap h. I]. When generating the least](https://dsd5zvtm8ll6.cloudfront.net/si.experts.images/questions/2024/09/66f70b5b968c3_33166f70b5b6e314.jpg)
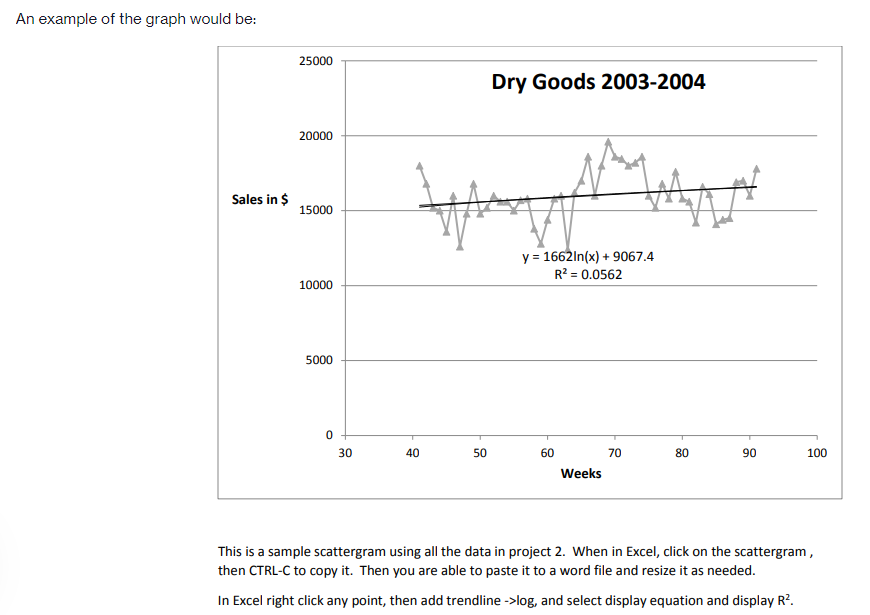
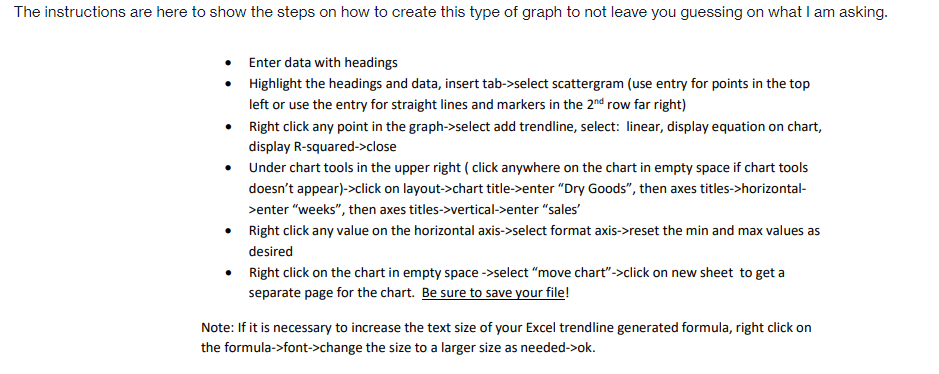
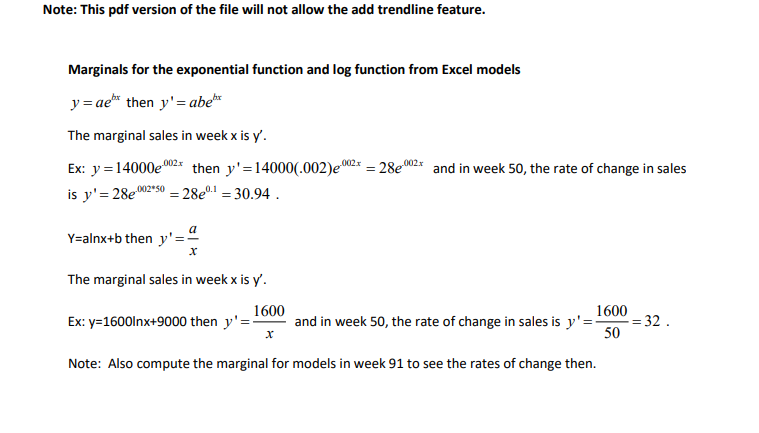
2. Modeling the data: a. Generate linear, logarithmic, and exponential models. Output one model on each grap h. I]. When generating the least squares models for this data, output the model and the FF value and discuss these results. c. What are the marginal sales [derivative, i.e. rate of change} forvan'ous weeks throughout the data set for this department using each model. Discuss with detail what the marginal sales for each model indicat. d. Analytically prepare predictions of sales for each model at weeks 95 and 10!]. Also compute rates of change {marginals} for each model at weeks 95 and ill]. e. Remove appropriate outliers as you deem necessary for your models and rerun the least squares models. What are the marginal sales and discuss any improvements. f. For your models with outliers removed, analytically prepare predictions of sales at weeks 95 and 150. Also compute rates of change {marginals} for each model at weeks 95 and 1m. 3. Comparing models a. Based on all models run, which model do you feel best predicts future trends? Explain your rationale. , compare your models and explain which you feel is overall the best to use in representing the overall data pattern and explain why? I]. Based on the model selected, what type of seasonal adjustments, if any, would be required to meet customer needs? {7'1 LJ These are the questions left to solve for me please: MATH.1220 Management Calculus Project #2 Wal'Mart Dry Goods Sales 2003-2004 The following items are a guide for responses to be addressed in project two. Note that WalMart's scal year starts the first week of February. This means that when analyzing the data, week 41 is actually week 45 [414-4 weeks for January] in 2003 or the beginning of November 2003. Also, week 52 is actually week 4 {52% weeks for January 2003 minus 52 weeks for 2003} in 2004 or the end of January 2004-. As an example. the spikes in sales {revenue} during weeks 70-24 start in week 22 [70-M- weeks for January 2003 minus 52 weeks for 2003} in 2004 or the first week in June 2004. and extend through week 25 in 2004 or the end of June 2004. This corresponds perhaps to sales for graduation celebrations during the beginning ofJune and preparation for the July 4'\" holiday when people are buying barbecue related items. All projects must be prepared in a word document format with imbedded Excel graphs. Students must work separately. Submit a single pdffile of your project to Blackboard. When doing your least squares modeling ofthe data, don't forget to generate the required models and then remove outliers {extreme values causing spikes in the data] and rerun the model. The results should improve with better R2 values. Discuss what outliers were selected, their calendar dates, and why the values were removed. Generate supporting Excel graphs [use scatter plots} to answer the following questions for the Dry Goods 2003-2004 data: 1. Identify spikes {outliers} in the data where extreme {high or low} sales values occur and correlate these spikes with actual calendar dates in 2003 or 2004 and with any holidays or special events or abnormally slow periods that may occur during these periods. An example of the graph would be: 25000 Dry Goods 2003-2004 20000 Sales in $ 15000 y = 1662In(x) + 9067.4 R2 = 0.0562 10000 5000 0 30 40 50 60 70 80 90 100 Weeks This is a sample scattergram using all the data in project 2. When in Excel, click on the scattergram , then CTRL-C to copy it. Then you are able to paste it to a word file and resize it as needed. In Excel right click any point, then add trendline ->log, and select display equation and display R2.The instructions are here to show the steps on how to create this type of graph to not leave you guessing on what I am asking. Enter data with headings . Highlight the headings and data, insert tab->select scattergram (use entry for points in the top left or use the entry for straight lines and markers in the 2"d row far right) . Right click any point in the graph->select add trendline, select: linear, display equation on chart, display R-squared->close . Under chart tools in the upper right ( click anywhere on the chart in empty space if chart tools doesn't appear)->click on layout->chart title->enter "Dry Goods", then axes titles->horizontal- >enter "weeks", then axes titles->vertical->enter "sales' Right click any value on the horizontal axis->select format axis->reset the min and max values as desired Right click on the chart in empty space ->select "move chart"->click on new sheet to get a separate page for the chart. Be sure to save your file! Note: If it is necessary to increase the text size of your Excel trendline generated formula, right click on the formula->font->change the size to a larger size as needed->ok.Note: This pdf version of the file will not allow the add trendline feature. Marginals for the exponential function and log function from Excel models y = ae" then y' = abel The marginal sales in week x is y'. Ex: y =14000e then y'=14000(.002)e * = 28e * and in week 50, the rate of change in sales is y' = 280230 =28el =30.94 . Y=alnx+b then y' = a X The marginal sales in week x is y'. 1600 1600 Ex: y=1600Inx+9000 then y' = and in week 50, the rate of change in sales is y'= = 32 . X 50 Note: Also compute the marginal for models in week 91 to see the rates of change then
Step by Step Solution
There are 3 Steps involved in it

Get step-by-step solutions from verified subject matter experts