

Question: 2. Name a major difference between a bar graph and a histogram?3. Rolling a single die would produce what type of distribution?4. State one of
2. Name a major difference between a bar graph and a histogram?3. Rolling a single die would produce what type of distribution?4. State one of the three properties of summation notation learned during the lectures. These are also known as 'rules' or identities.5. State one of the four common summations learned during the lectures. Hint: these simplify calculation of a long series.6. True or False. Percentiles are the same as percents.7. True or False. If the median is near the centre of a box and whisker plot, the distributionis approximately symmetric.8. Outliers have the largest effect on which measure of central tendency?
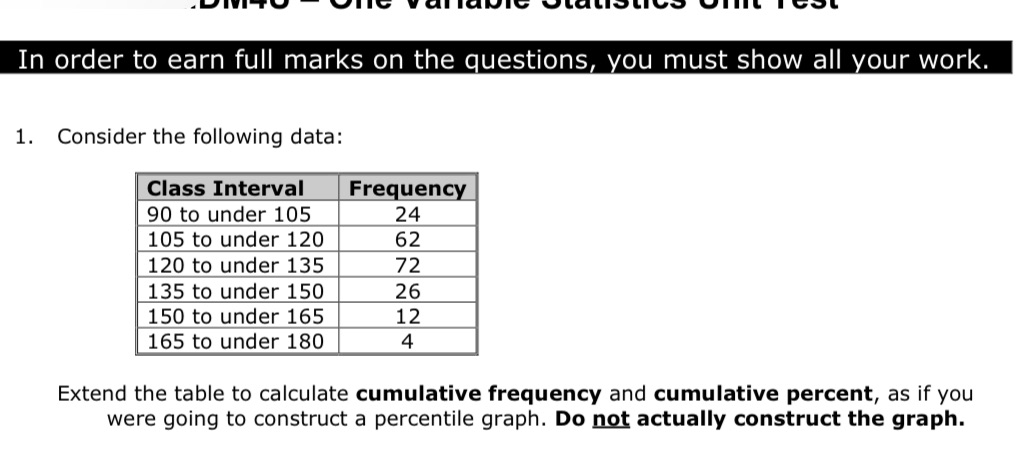
In order to earn full marks on the questions, you must show all your work. 1. Consider the following data: Class Interval Frequency 90 to under 105 24 105 to under 120 62 120 to under 135 72 135 to under 150 26 150 to under 165 12 165 to under 180 4 Extend the table to calculate cumulative frequency and cumulative percent, as if you were going to construct a percentile graph. Do not actually construct the graph
Step by Step Solution
There are 3 Steps involved in it

Get step-by-step solutions from verified subject matter experts