

Question: 2. On the plot below, the logistic model predicts per-capita birth rates to fall along the solid line. The points show your actual data for
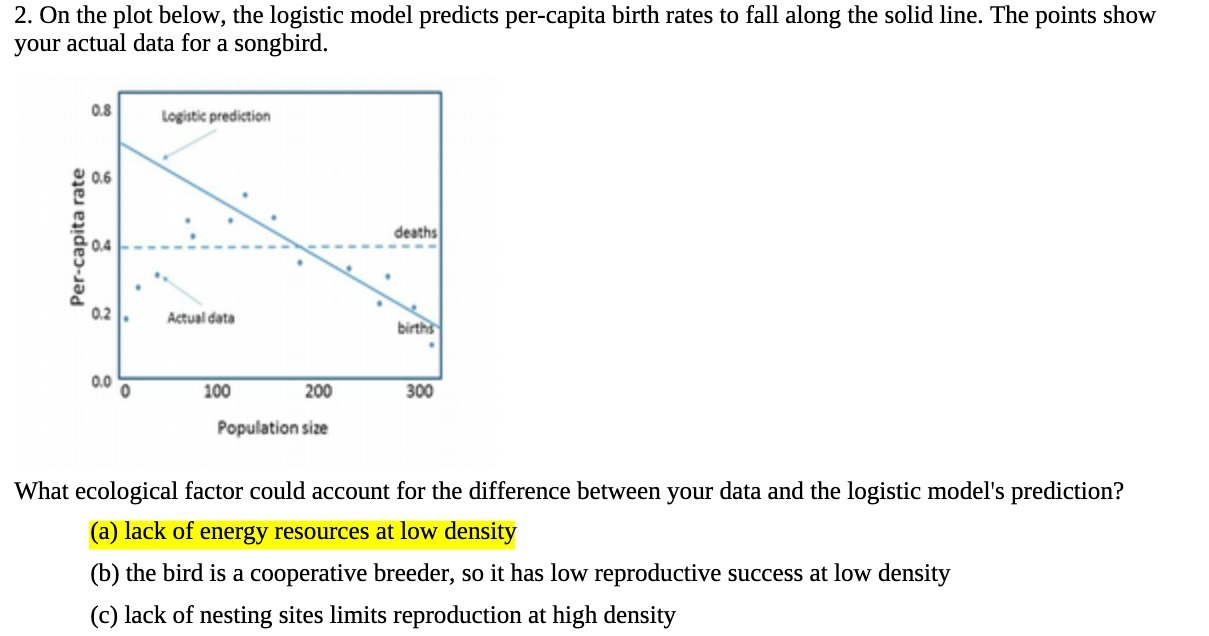
2. On the plot below, the logistic model predicts per-capita birth rates to fall along the solid line. The points show your actual data for a songbird. 0.8 Logistic prediction 0.6 deaths Per-capita rate 0.4 0.2 Actual data births 0.0 0 100 200 300 Population size What ecological factor could account for the difference between your data and the logistic model's prediction? (a) lack of energy resources at low density (b) the bird is a cooperative breeder, so it has low reproductive success at low density (c) lack of nesting sites limits reproduction at high density
Step by Step Solution
There are 3 Steps involved in it
1 Expert Approved Answer
Step: 1 Unlock

Question Has Been Solved by an Expert!
Get step-by-step solutions from verified subject matter experts
Step: 2 Unlock
Step: 3 Unlock