

Question: #2 parts a, b, c, d, and e as well as #3 (multiple choice) 2. The researcher also ran the following simple linear regression model
#2 parts a, b, c, d, and e as well as #3 (multiple choice)
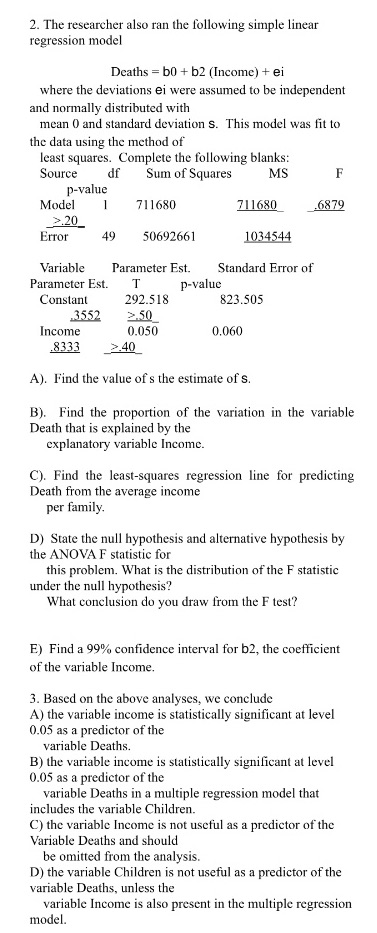
2. The researcher also ran the following simple linear regression model Deaths = b0 + b2 (Income) + ei where the deviations ei were assumed to be independent and normally distributed with mean 0 and standard deviation s. This model was fit to the data using the method of least squares. Complete the following blanks: Source df Sum of Squares MS F p-value Model 1 71 1680 71 1680 .6879 >.20 Error 49 50692661 1034544 Variable Parameter Est. Standard Error of Parameter Est. T p-value Constant 292.518 823.505 3552 >.50 Income 0.050 0.060 8333 >.40 A). Find the value of s the estimate of s. B). Find the proportion of the variation in the variable Death that is explained by the explanatory variable Income. C). Find the least-squares regression line for predicting Death from the average income per family. D) State the null hypothesis and alternative hypothesis by the ANOVA F statistic for this problem. What is the distribution of the F statistic under the null hypothesis? What conclusion do you draw from the F test? E) Find a 99% confidence interval for b2, the coefficient of the variable Income. 3. Based on the above analyses, we conclude A) the variable income is statistically significant at level 0.05 as a predictor of the variable Deaths. B) the variable income is statistically significant at level 0.05 as a predictor of the variable Deaths in a multiple regression model that includes the variable Children. C) the variable Income is not useful as a predictor of the Variable Deaths and should be omitted from the analysis. D) the variable Children is not useful as a predictor of the variable Deaths, unless the variable Income is also present in the multiple regression model
Step by Step Solution
There are 3 Steps involved in it

Get step-by-step solutions from verified subject matter experts