

Question: 2. Pay attention to Table 2 above. a. What can you conclude? Describe your analysis! b. Based on your analysis of answer (2.a). What is
2. Pay attention to Table 2 above. a. What can you conclude? Describe your analysis! b. Based on your analysis of answer (2.a). What is the impact on government revenues and expenditures? c. According to your analysis (2.b), what can the government do to deal with this?
min. 100 word
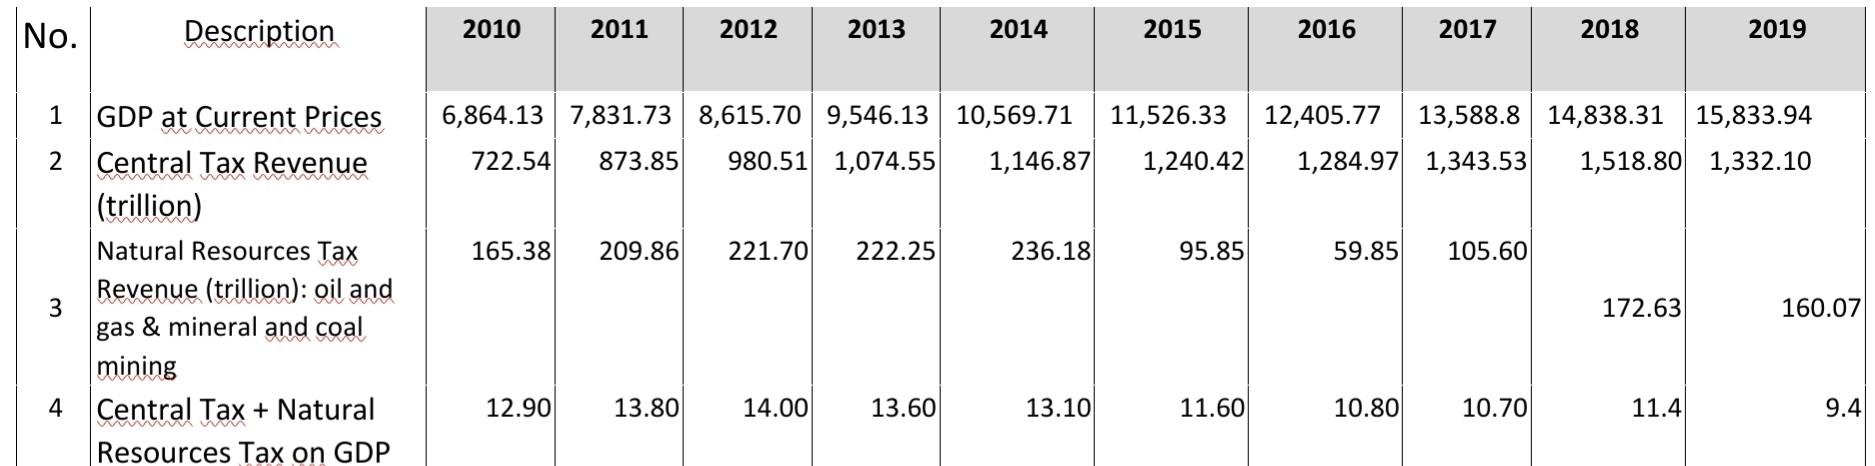
No. 1 GDP at Current Prices 2 Central Tax Revenue immmmmmmmm immmmmmm (trillion) 3 Description 4 Natural Resources Tax Revenue (trillion): oil and gas & mineral and coal mining Central Tax + Natural mwimmin un Resources Tax on GDP 2010 2011 12.90 2012 165.38 209.86 221.70 222.25 13.80 2013 14.00 2014 13.60 15,833.94 6,864.13 7,831.73 8,615.70 9,546.13 10,569.71 11,526.33 12,405.77 13,588.8 14,838.31 722.54 873.85 980.51 1,074.55 1,146.87 1,240.42 1,284.97 1,343.53 1,518.80 1,332.10 236.18 2015 13.10 95.85 2016 11.60 2017 59.85 105.60 10.80 2018 10.70 172.63 2019 11.4 160.07 9.4
Step by Step Solution
There are 3 Steps involved in it

Get step-by-step solutions from verified subject matter experts