

Question: 2. Perplexed by the declining profit margin and the rate of growth of Q CORP's net income, Mary Hampton pressed the company management for
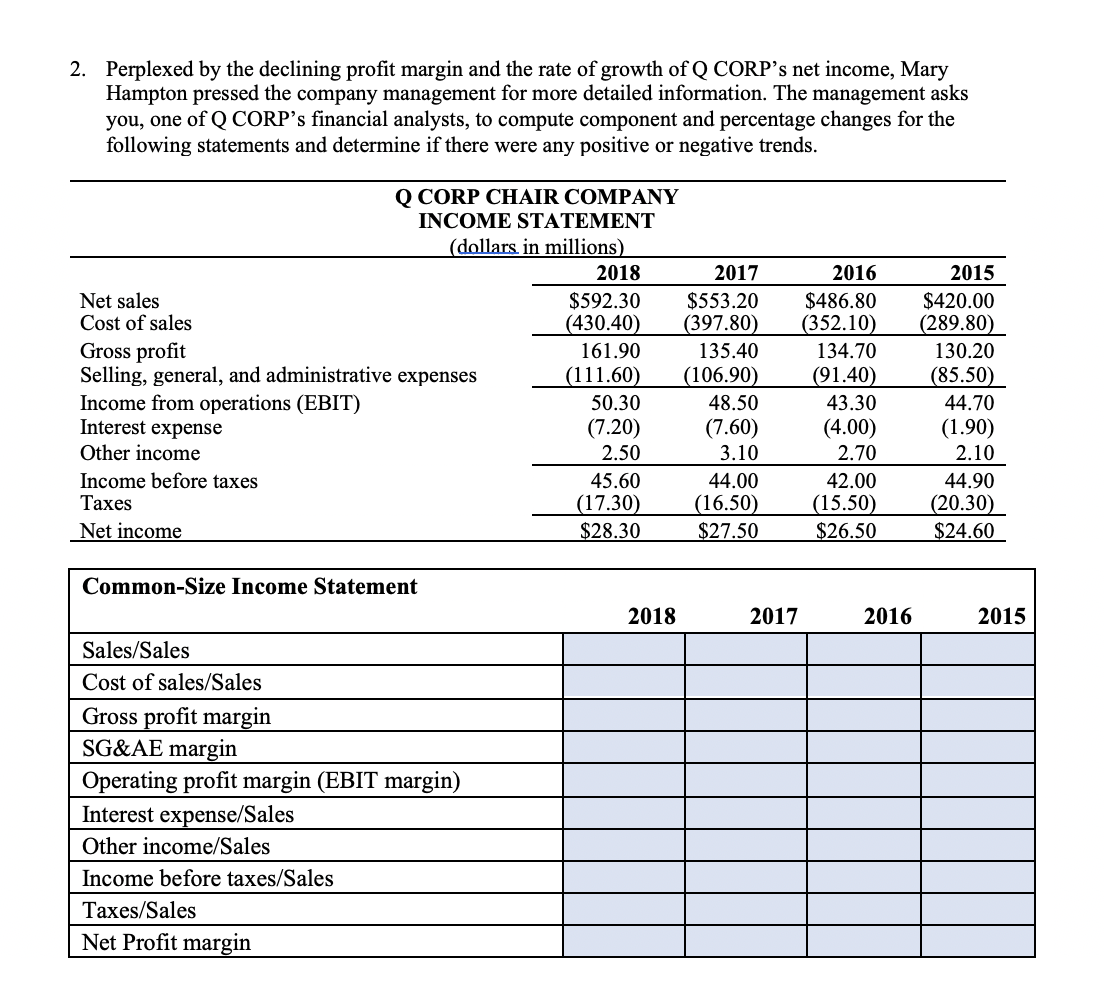
2. Perplexed by the declining profit margin and the rate of growth of Q CORP's net income, Mary Hampton pressed the company management for more detailed information. The management asks you, one of Q CORP's financial analysts, to compute component and percentage changes for the following statements and determine if there were any positive or negative trends. Q CORP CHAIR COMPANY INCOME STATEMENT (dollars in millions) 2018 2017 2016 Net sales $592.30 $553.20 $486.80 Cost of sales (430.40) (397.80) (352.10) 2015 $420.00 (289.80) Gross profit 161.90 135.40 134.70 130.20 Selling, general, and administrative expenses (111.60) (106.90) (91.40) (85.50) Income from operations (EBIT) 50.30 48.50 43.30 44.70 Interest expense (7.20) (7.60) (4.00) (1.90) Other income 2.50 3.10 2.70 2.10 Income before taxes 45.60 44.00 42.00 Taxes (17.30) (16.50) (15.50) 44.90 (20.30) Net income $28.30 $27.50 $26.50 $24.60 Common-Size Income Statement Sales/Sales Cost of sales/Sales Gross profit margin SG&AE margin Operating profit margin (EBIT margin) Interest expense/Sales Other income/Sales Income before taxes/Sales Taxes/Sales Net Profit margin 2018 2017 2016 2015
Step by Step Solution
There are 3 Steps involved in it

Get step-by-step solutions from verified subject matter experts