

Question: ( 2 ) PivotTable Analysis Create a pivot table that looks like the following. Name the tab PivotTable. table [ [ 4 2 ,
PivotTable Analysis
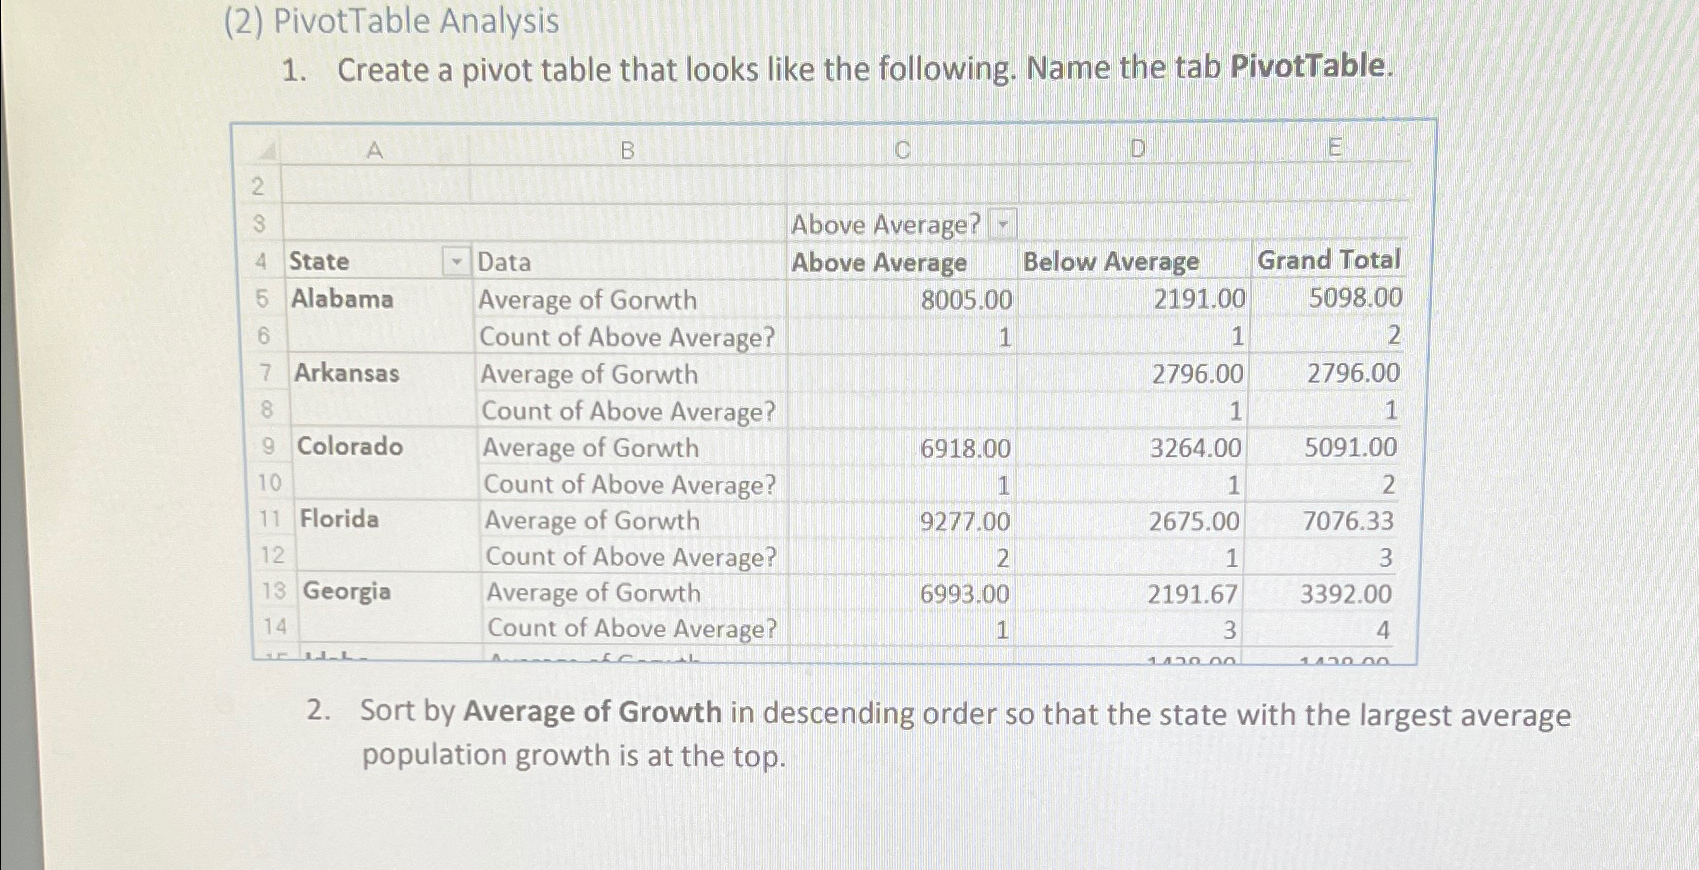
Create a pivot table that looks like the following. Name the tab PivotTable.
tableABCDEAbove,iverage? State,Data,Above,Iverage,Below Average,Grand TotalAlabama,,Average of Gorwth,,Count of Above Average?,,Arkansas,,Average of Gorwth,,,Count of Above Average?,,,Colorado,,Average of Gorwth,,Count of Above Average?,,Florida,,Average of Gorwth,,Count of Above Average?,,Georgia,,Average of Gorwth,,Count of Above Average?,,
Sort by Average of Growth in descending order so that the state with the largest average population growth is at the top.
Step by Step Solution
There are 3 Steps involved in it
1 Expert Approved Answer
Step: 1 Unlock

Question Has Been Solved by an Expert!
Get step-by-step solutions from verified subject matter experts
Step: 2 Unlock
Step: 3 Unlock