

Question: 2. Plot the following signals using MATLAB over suitable time ranges. (5X4-20 points) a) A CT sinusoid of frequency 10 and amplitude 3 b) A
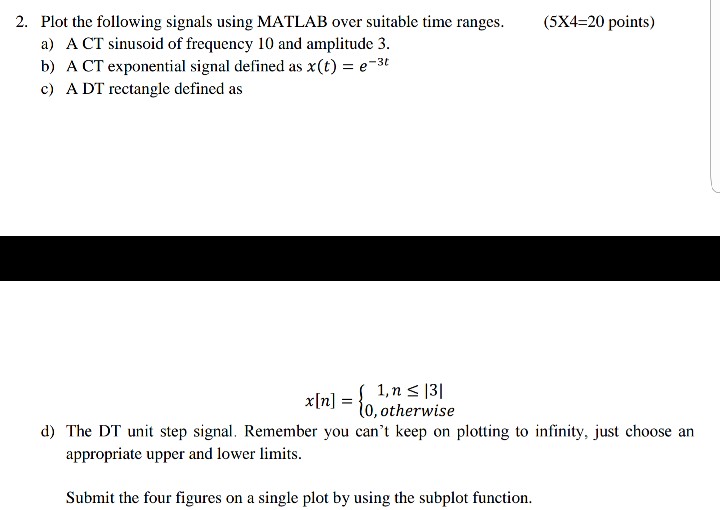
2. Plot the following signals using MATLAB over suitable time ranges. (5X4-20 points) a) A CT sinusoid of frequency 10 and amplitude 3 b) A CT exponential signal defined as x(t)-e31 c) A DT rectangle defined as 1, n s 13] xlnl-to, otherwise d) The DT unit step signal. Remember you can't keep on plotting to infinity, just choose an appropriate upper and lower limits Submit the four figures on a single plot by using the subplot function
Step by Step Solution
There are 3 Steps involved in it
1 Expert Approved Answer
Step: 1 Unlock

Question Has Been Solved by an Expert!
Get step-by-step solutions from verified subject matter experts
Step: 2 Unlock
Step: 3 Unlock