

Question: 2 points EXTRA CREDI (2 points). This problem is optional. A regression model (not necessarily linear) has been fit between an explanatory variable and a
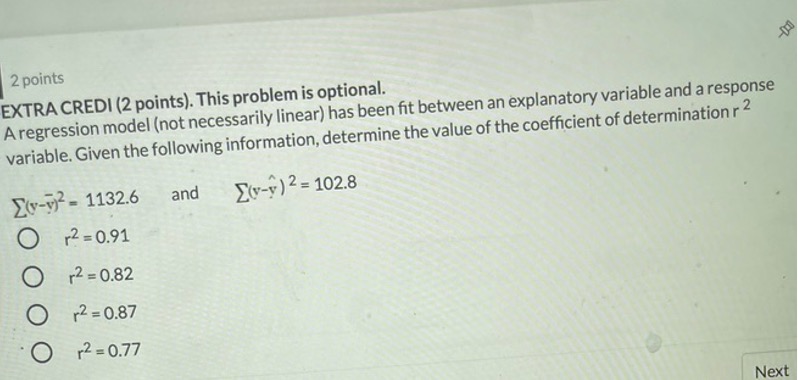
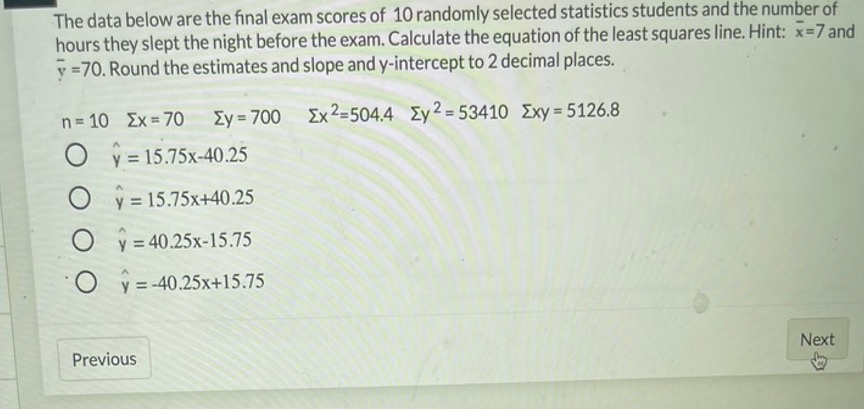
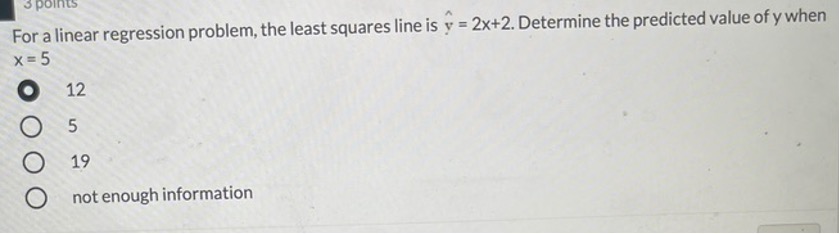
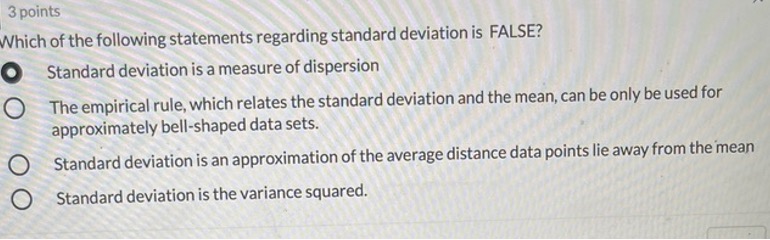
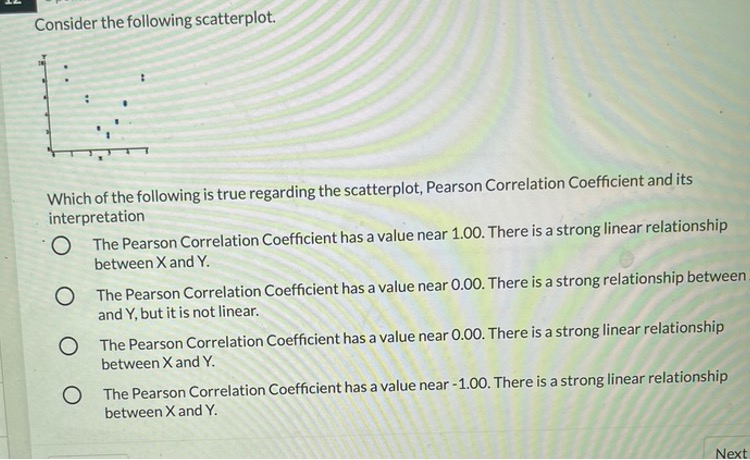
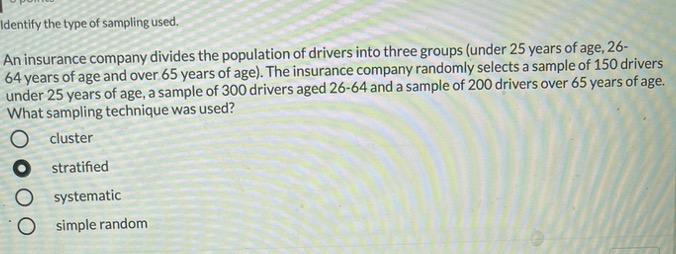
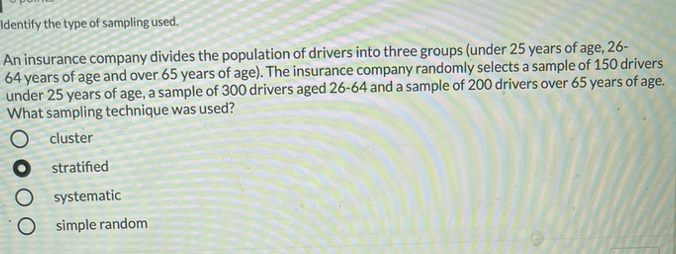
2 points EXTRA CREDI (2 points). This problem is optional. A regression model (not necessarily linear) has been fit between an explanatory variable and a response variable. Given the following information, determine the value of the coefficient of determination r 2 [(v-v)2 = 1132.6 and [(v-y ) 2 = 102.8 O r2=0.91 O r2 =0.82 O r2 =0.87 O r2 =0.77 NextThe data below are the final exam scores of 10 randomly selected statistics students and the number of hours they slept the night before the exam. Calculate the equation of the least squares line. Hint: x=7 and y =70. Round the estimates and slope and y-intercept to 2 decimal places. n = 10 Ex =70 Ey =700 Ex 2=504.4 Zy 2 = 53410 Exy = 5126.8 O y = 15.75x-40.25 O y = 15.75x+40.25 O y = 40.25x-15.75 O y=-40.25x+15.75 Previous Next3 points For a linear regression problem, the least squares line is y = 2x+2. Determine the predicted value of y when x = 5 O 12 5 O 19 C not enough information3 points Which of the following statements regarding standard deviation is FALSE? O Standard deviation is a measure of dispersion The empirical rule, which relates the standard deviation and the mean, can be only be used for approximately bell-shaped data sets. Standard deviation is an approximation of the average distance data points lie away from the mean O Standard deviation is the variance squared.Consider the following scatterplot. Which of the following is true regarding the scatterplot, Pearson Correlation Coefficient and its interpretation O The Pearson Correlation Coefficient has a value near 1.00. There is a strong linear relationship between X and Y. O The Pearson Correlation Coefficient has a value near 0.00. There is a strong relationship between and Y, but it is not linear. O The Pearson Correlation Coefficient has a value near 0.00. There is a strong linear relationship between X and Y. O The Pearson Correlation Coefficient has a value near - 1.00. There is a strong linear relationship between X and Y. NextIdentify the type of sampling used. An insurance company divides the population of drivers into three groups (under 25 years of age, 26- 64 years of age and over 65 years of age). The insurance company randomly selects a sample of 150 drivers under 25 years of age, a sample of 300 drivers aged 26-64 and a sample of 200 drivers over 65 years of age. What sampling technique was used? O cluster stratified O systematic C simple randomIdentify the type of sampling used. An insurance company divides the population of drivers into three groups (under 25 years of age, 26- 64 years of age and over 65 years of age). The insurance company randomly selects a sample of 150 drivers under 25 years of age, a sample of 300 drivers aged 26-64 and a sample of 200 drivers over 65 years of age. What sampling technique was used? O cluster stratified O systematic C simple random
Step by Step Solution
There are 3 Steps involved in it

Get step-by-step solutions from verified subject matter experts