

Question: (2 points) Grade on Statistics Exam Frequency Below 50 50-59 387 60-69 70-79 13 80-89 16 90-100 12 Given the frequency table above, construct
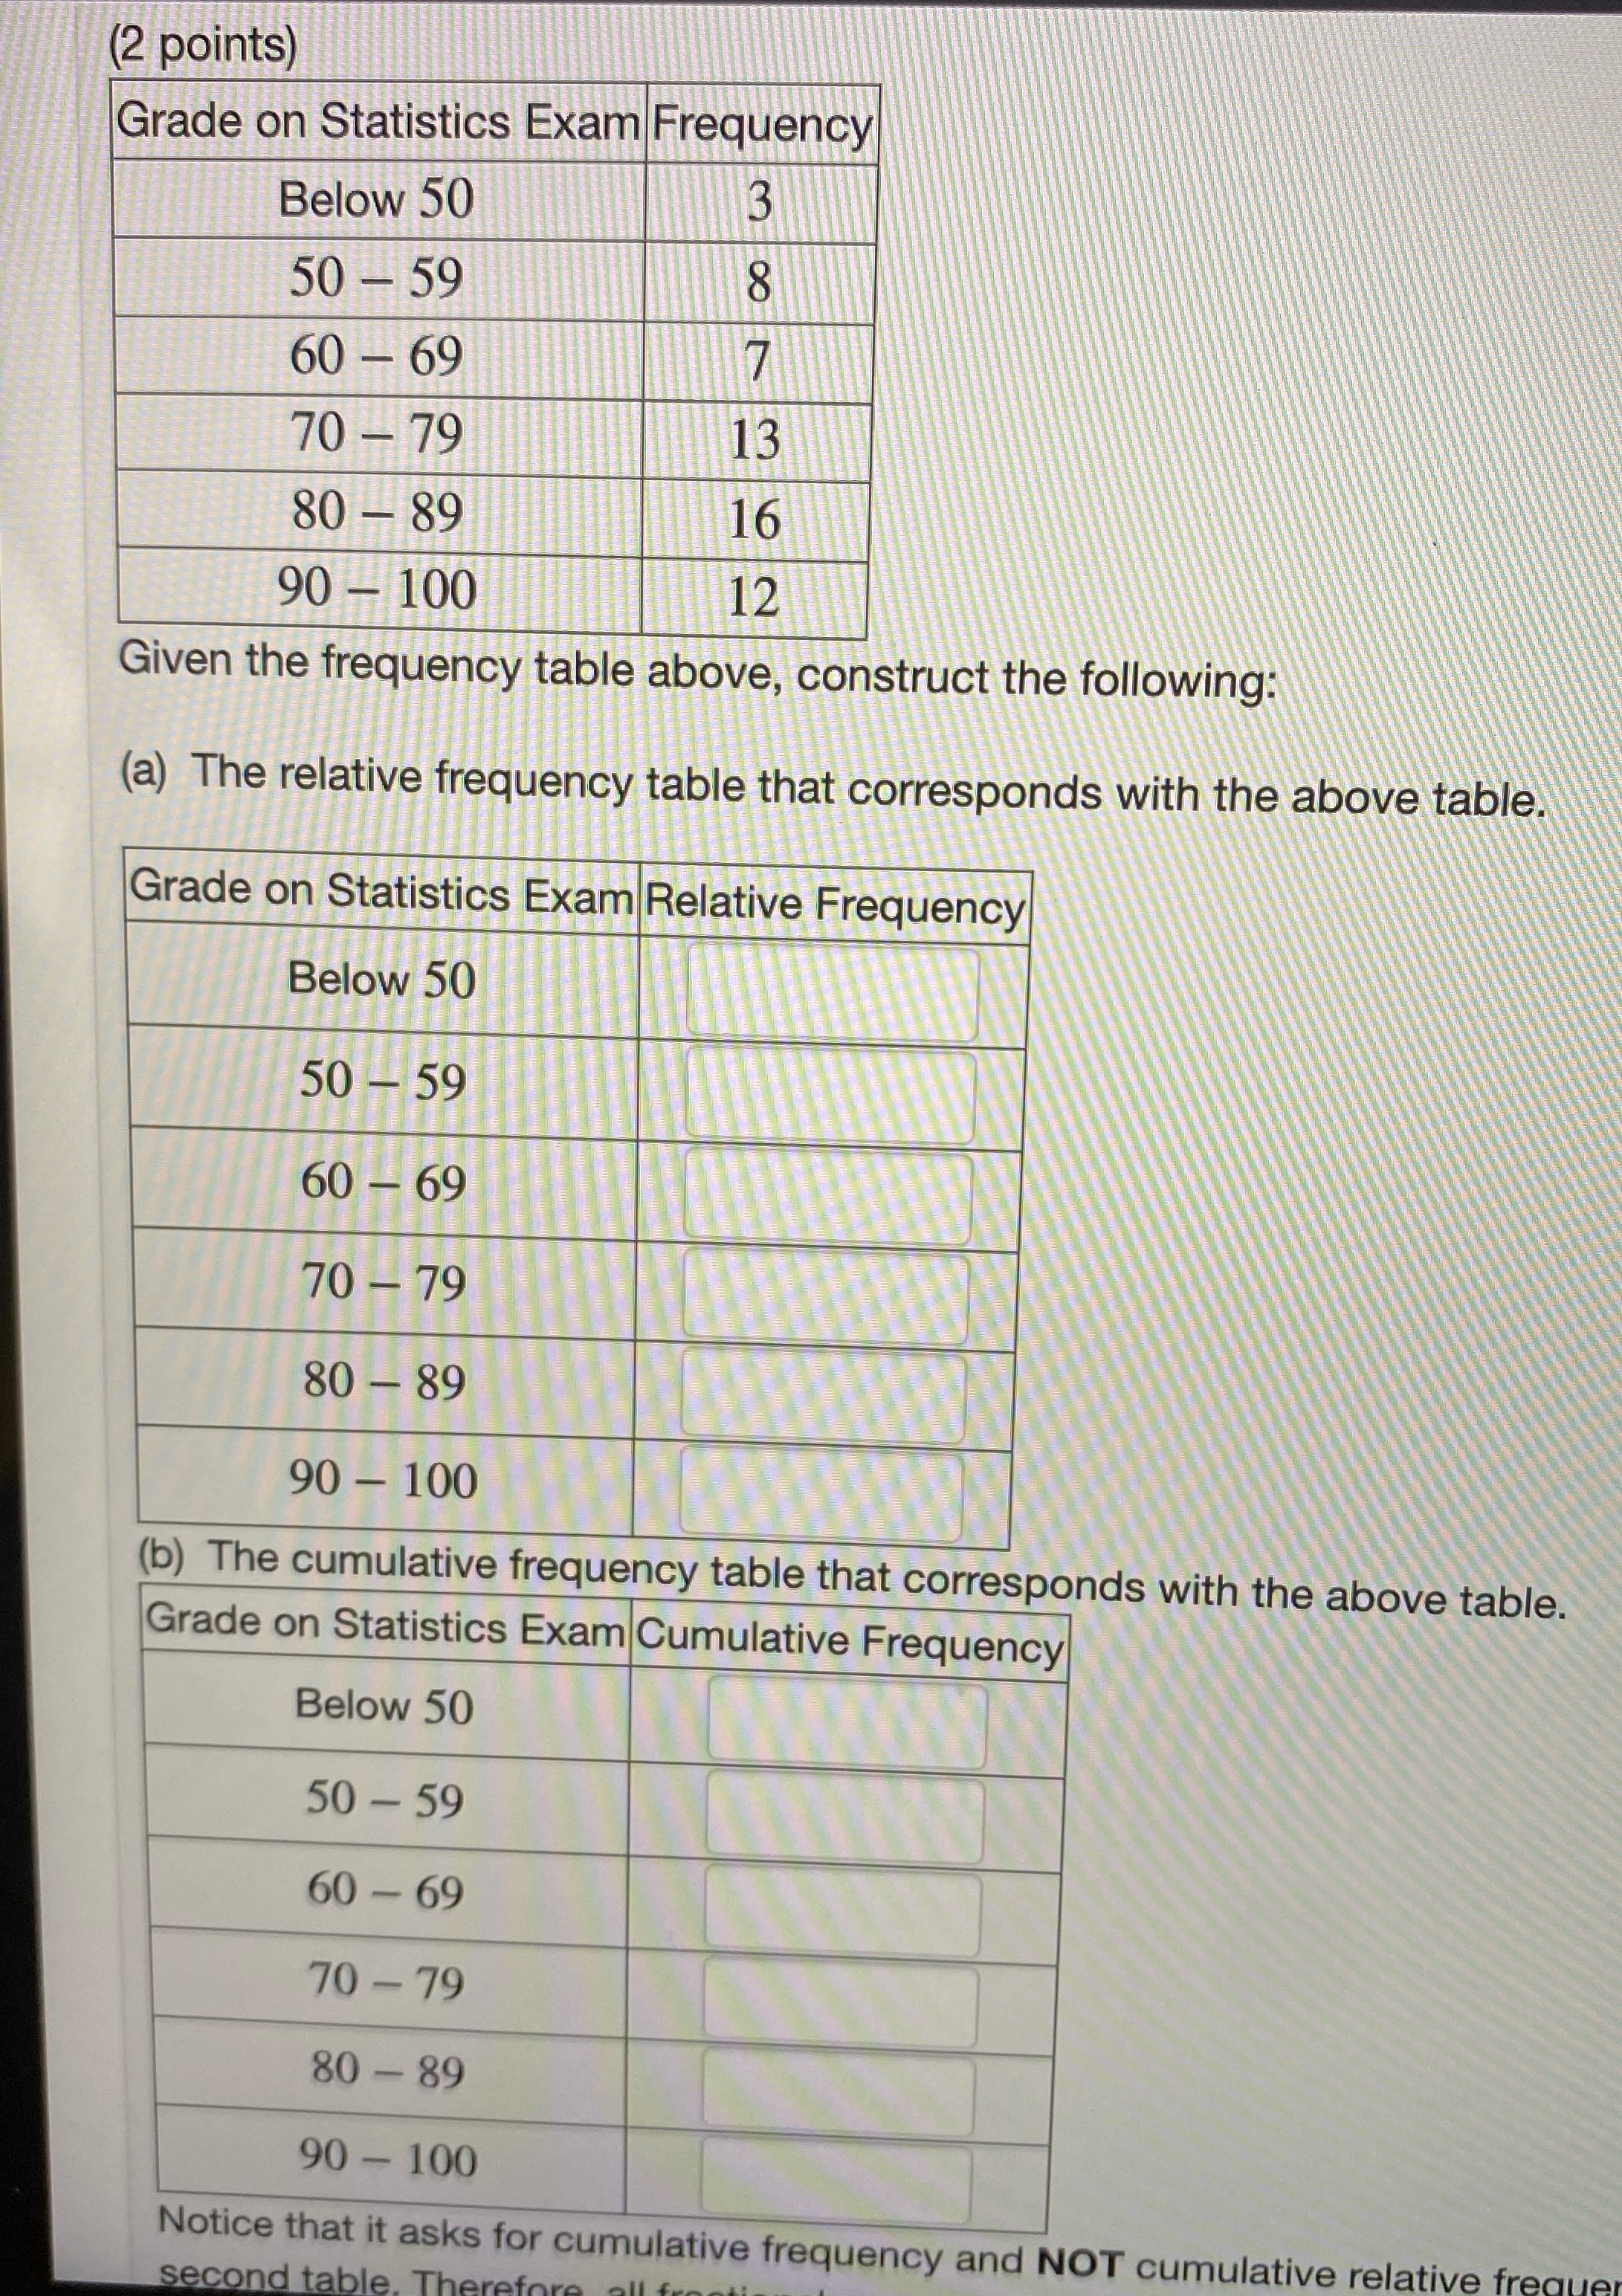
(2 points) Grade on Statistics Exam Frequency Below 50 50-59 387 60-69 70-79 13 80-89 16 90-100 12 Given the frequency table above, construct the following: (a) The relative frequency table that corresponds with the above table. Grade on Statistics Exam Relative Frequency Below 50 50-59 60-69 70-79 80-89 90-100 (b) The cumulative frequency table that corresponds with the above table. Grade on Statistics Exam Cumulative Frequency Below 50 50-59 60-69 70-79 80-89 90-100 Notice that it asks for cumulative frequency and NOT cumulative relative frequer second table. Therefore all fre
Step by Step Solution
There are 3 Steps involved in it
1 Expert Approved Answer
Step: 1 Unlock

Question Has Been Solved by an Expert!
Get step-by-step solutions from verified subject matter experts
Step: 2 Unlock
Step: 3 Unlock