

Question: (2 points) The following diagram shows a boxplot for the lifetimes (in months) of a sample of 30 light bulbs. 40 60 80 Lifetime of
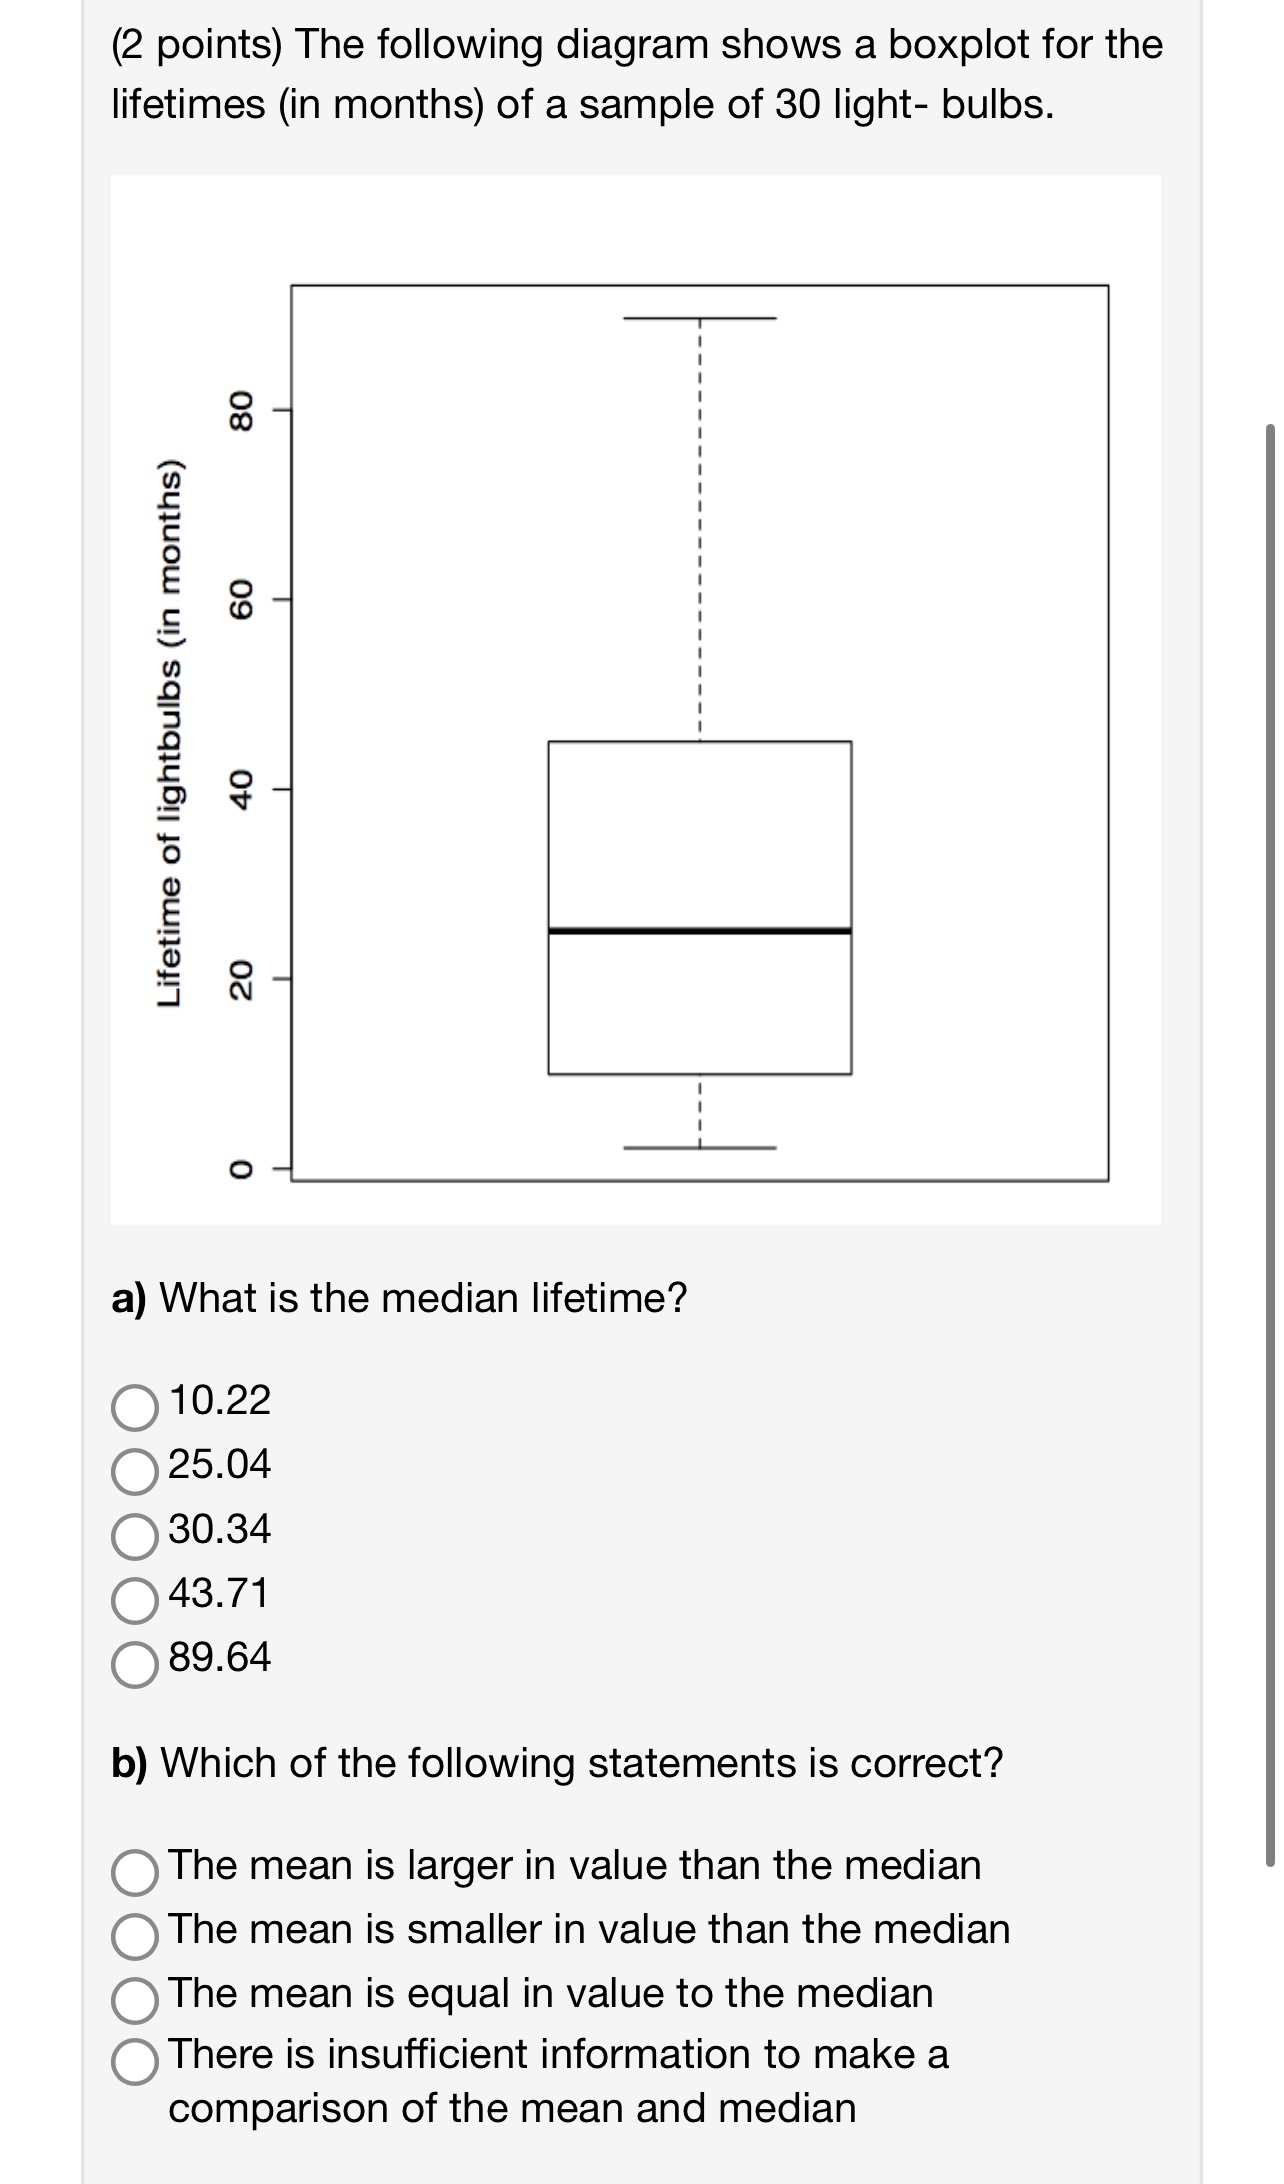

(2 points) The following diagram shows a boxplot for the lifetimes (in months) of a sample of 30 light bulbs. 40 60 80 Lifetime of lightbulbs (in months) 20 a) What is the median lifetime? 0 10.22 025.04 030.34 043.71 0 89.64 b) Which of the following statements is correct? OThe mean is larger in value than the median OThe mean is smaller in value than the median OThe mean is equal in value to the median OThere is insufficient information to make a comparison of the mean and median
Step by Step Solution
There are 3 Steps involved in it
1 Expert Approved Answer
Step: 1 Unlock

Question Has Been Solved by an Expert!
Get step-by-step solutions from verified subject matter experts
Step: 2 Unlock
Step: 3 Unlock