

Question: (2 points )Use the data in the Michigan calf weights worksheet. These are calf weights at birth (lbs.) collected from a random sample of Holstein
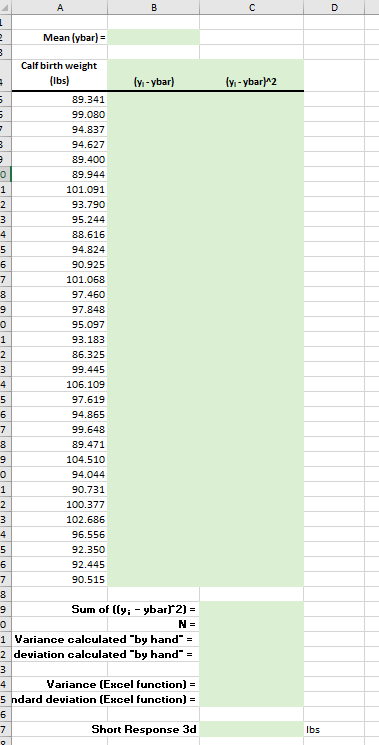
- (2 points )Use the data in the Michigan calf weights worksheet. These are calf weights at birth (lbs.) collected from a random sample of Holstein calves born in Michigan last year. Your objective is to calculate the variance and the standard deviation of calf birth-weights. Follow the instructions below carefully. You will have filled in all of the green-shaded cells by the end of the problem .
-
- In cell B2, use the appropriate Excel function to calculate the mean of the observed calf birth weights. Report the mean to 3 decimal places.
-
- Using the steps we covered in Class #11, calculate the variance and standard deviation by hand, keeping 3 decimal places for all of your answers except for N, which should be a whole number. All of the formulas you need to do this are in the Class #11 notes and Excel examples in D2L. Make sure you use an Excel function to calculate N and an absolute reference when you calculate the values in the yi - ybar column. Read the problem carefully to determine whether you should be using the population or sample variance and standard deviation formulas.
-
- Now, calculate the variance and the standard deviation using the appropriate Excel functions. Note that these values should exactly match your by hand calculations. Here again, read the problem carefully to determine which Excel functions you should be using to calculate the variance and standard deviation in this problem. Report 3 decimal places.
-
- Suppose a new calf was born that weighed 3 standard deviations more than our sample mean. How much would that calf weigh? Use an Excel formula to calculate your answer in cell C47 and report 3 decimal places.
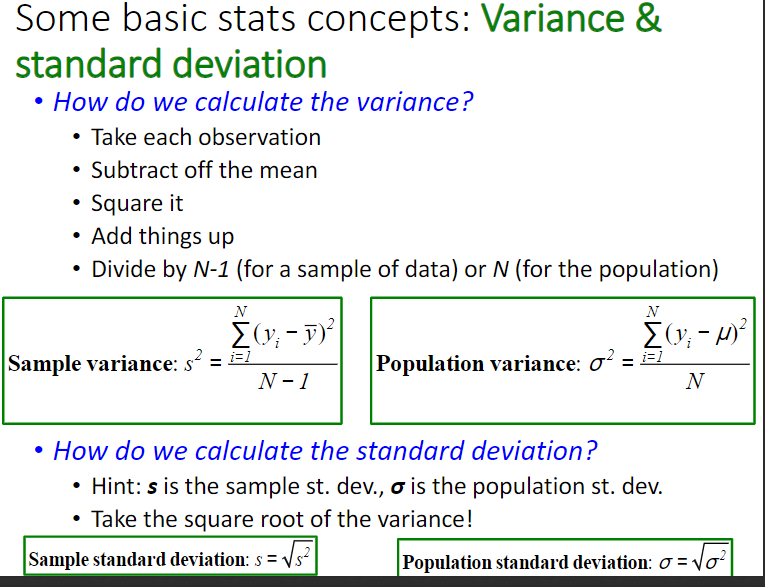
Mean (ybar) Calfbirth weight lbs) (v-ybar) (n-ybarh2 89.341 99.080 94.837 94.627 89.400 89.944 101.091 93.790 95.244 88.616 94.824 90.925 101.068 97.460 97.848 95.097 93.183 86.325 99.445 106.109 97.619 94.865 99.648 89.471 104.510 94.044 90.731 100.377 102.686 96.556 92.350 92.445 90.515 Sum of ly ybarJ2) 1 Variance calculated "by hand 2 deviation calculated "by hand- Variance (Excel function)- 5 ndard deviation (Excel function) = Short Response 3d lbs Some basic stats concepts: Variance 8 standard deviation How do we calculate the variance? Take each observation Subtract off the mean Square it . Add things up Divide by N-1 (for a sample of data) or N (for the population) Sample variance. S2-1-1 I Population variance: N-1 How do we calculate the standard deviation? . Hint: s is the sample st. dev., is the population st. dev. Take the square root of the variance! Sample standard deviation: s-Vs Population standard deviation:
Step by Step Solution
There are 3 Steps involved in it

Get step-by-step solutions from verified subject matter experts