

Question: 2) Problem 26 in Chapter 8, part (b). Total income in the data set is the total annual income. You have to find 6 confidence
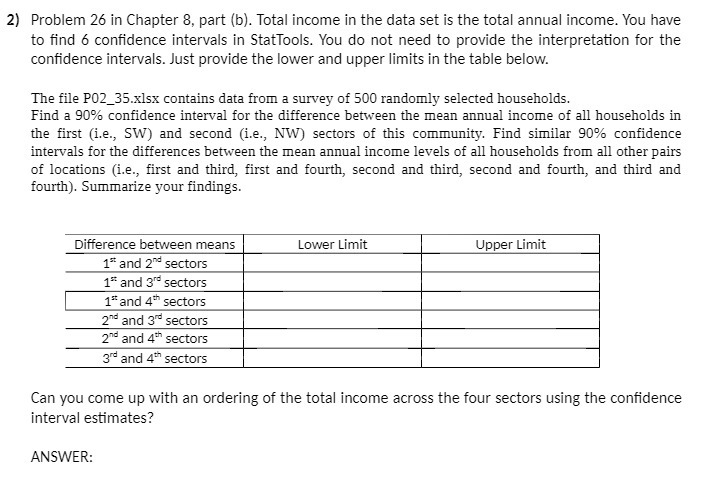
2) Problem 26 in Chapter 8, part (b). Total income in the data set is the total annual income. You have to find 6 confidence intervals in StatTools. You do not need to provide the interpretation for the confidence intervals. Just provide the lower and upper limits in the table below. The file P02_35.xlsx contains data from a survey of 500 randomly selected households. Find a 90% confidence interval for the difference between the mean annual income of all households in the first (i.e., SW) and second (i.e., NW) sectors of this community. Find similar 90% confidence intervals for the differences between the mean annual income levels of all households from all other pairs of locations (i.e., first and third, first and fourth, second and third, second and fourth, and third and fourth). Summarize your findings. Difference between means Lower Limit Upper Limit 1" and 2" sectors 1" and 3" sectors 1" and 4" sectors 2" and 3" sectors 2" and 4" sectors 3" and 4" sectors Can you come up with an ordering of the total income across the four sectors using the confidence interval estimates?
Step by Step Solution
There are 3 Steps involved in it

Get step-by-step solutions from verified subject matter experts