Question: 2 Randomness in selecting a sample from a population is crucial in conducting effective and accurate statistical analyses. The RAND function in Excel is one
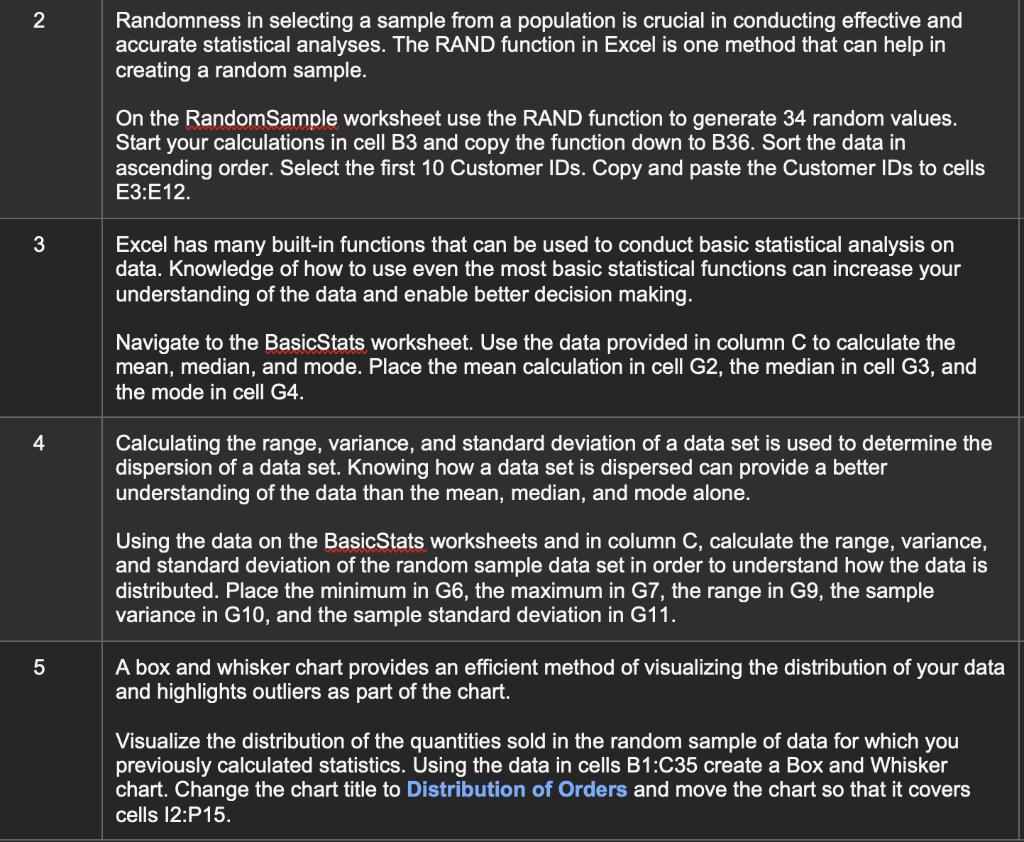
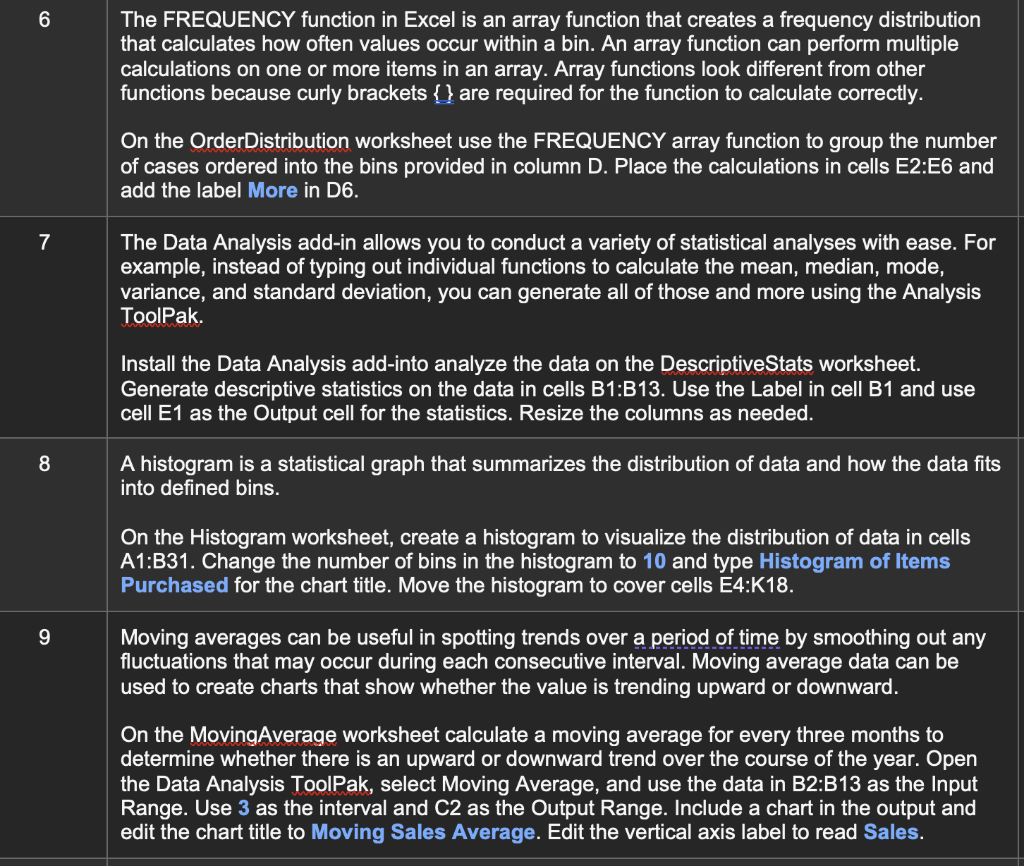
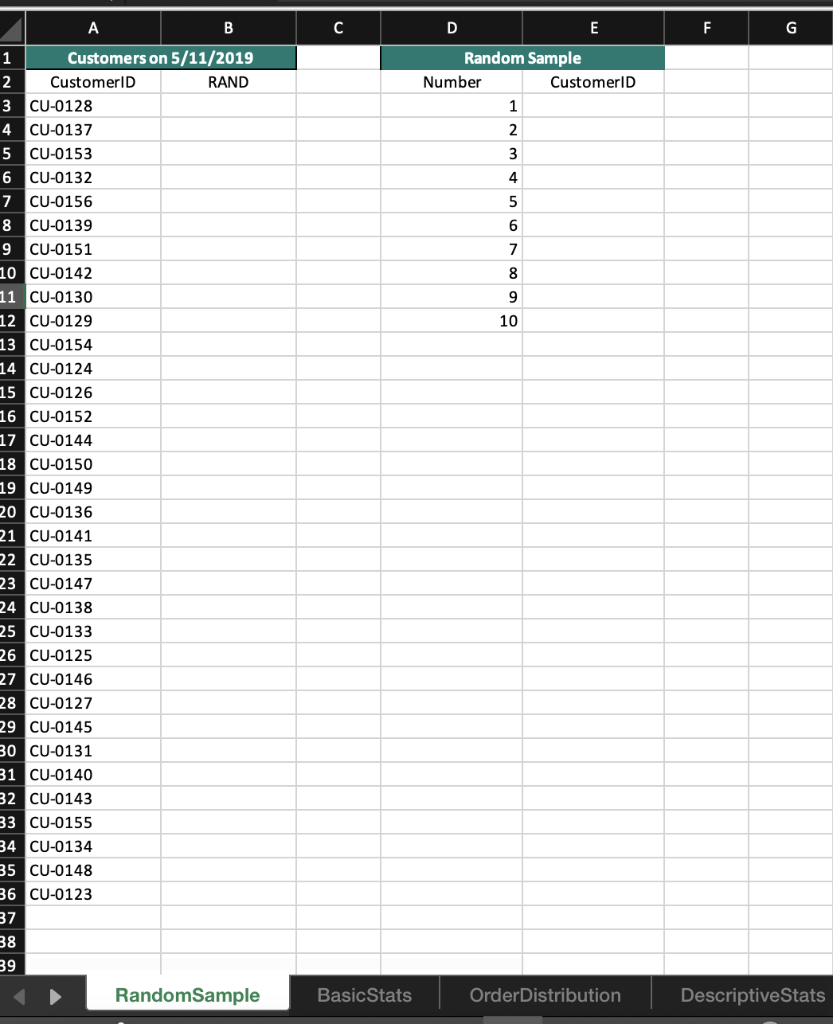
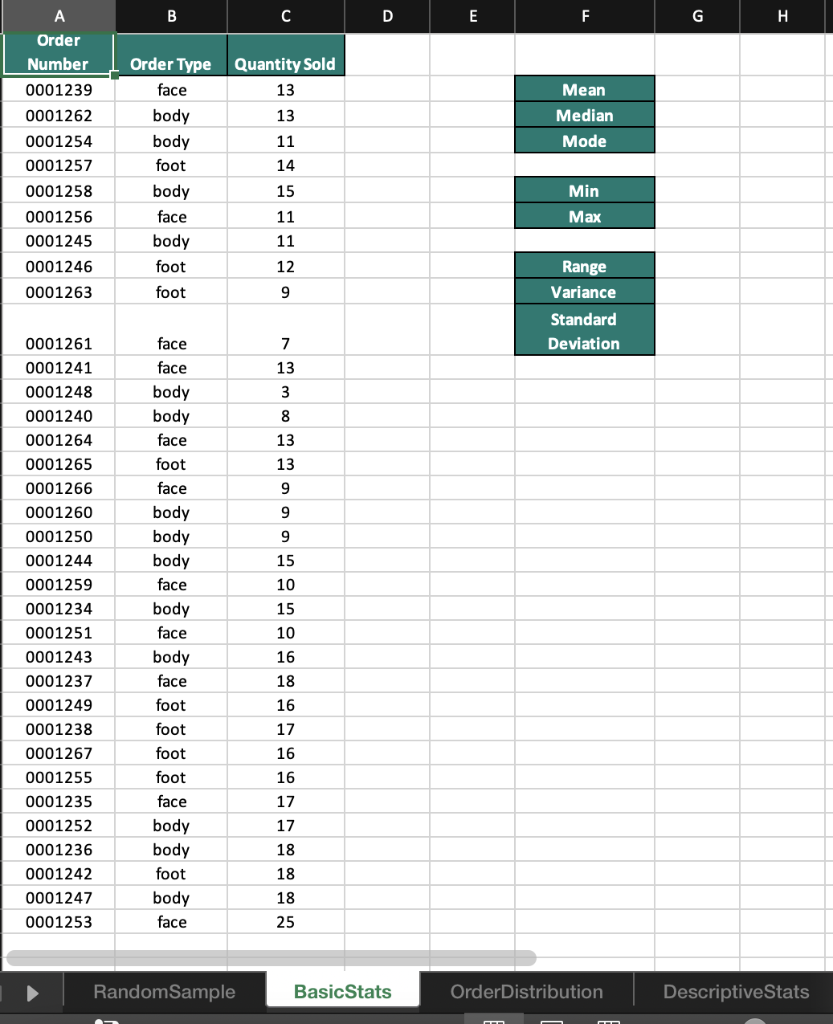
2 Randomness in selecting a sample from a population is crucial in conducting effective and accurate statistical analyses. The RAND function in Excel is one method that can help in creating a random sample. On the RandomSample worksheet use the RAND function to generate 34 random values. Start your calculations in cell B3 and copy the function down to B36. Sort the data in ascending order. Select the first 10 Customer IDs. Copy and paste the Customer IDs to cells E3:E12. 3 Excel has many built-in functions that can be used to conduct basic statistical analysis on data. Knowledge of how to use even the most basic statistical functions can increase your understanding of the data and enable better decision making. Navigate to the BasicStats worksheet. Use the data provided in column C to calculate the mean, median, and mode. Place the mean calculation in cell G2, the median in cell G3, and the mode in cell G4. 4 Calculating the range, variance, and standard deviation of a data set is used to determine the dispersion of a data set. Knowing how a data set is dispersed can provide a better understanding of the data than the mean, median, and mode alone. Using the data on the BasicStats worksheets and in column C, calculate the range, variance, and standard deviation of the random sample data set in order to understand how the data is distributed. Place the minimum in G6, the maximum in G7, the range in G9, the sample variance in G10, and the sample standard deviation in G11. A box and whisker chart provides an efficient method of visualizing the distribution of your data and highlights outliers as part of the chart. Visualize the distribution of the quantities sold in the random sample of data for which you previously calculated statistics. Using the data in cells B1:C35 create a Box and Whisker chart. Change the chart title to Distribution of Orders and move the chart so that it covers cells 12:P15. 5 6 The FREQUENCY function in Excel is an array function that creates a frequency distribution that calculates how often values occur within a bin. An array function can perform multiple calculations on one or more items in an array. Array functions look different from other functions because curly brackets {} are required for the function to calculate correctly. On the Order Distribution worksheet use the FREQUENCY array function to group the number of cases ordered into the bins provided in column D. Place the calculations in cells E2:E6 and add the label More in D6. 7 The Data Analysis add-in allows you to conduct a variety of statistical analyses with ease. For example, instead of typing out individual functions to calculate the mean, median, mode, variance, and standard deviation, you can generate all of those and more using the Analysis ToolPak. Install the Data Analysis add-into analyze the data on the DescriptiveStats worksheet. Generate descriptive statistics on the data in cells B1:B13. Use the Label in cell B1 and use cell E1 as the Output cell for the statistics. Resize the columns as needed. 8 A histogram is a statistical graph that summarizes the distribution of data and how the data fits into defined bins. On the Histogram worksheet, create a histogram to visualize the distribution of data in cells A1:B31. Change the number of bins in the histogram to 10 and type Histogram of Items Purchased for the chart title. Move the histogram to cover cells E4:K18. Moving averages can be useful in spotting trends over a period of time by smoothing out any fluctuations that may occur during each consecutive interval. Moving average data can be used to create charts that show whether the value is trending upward or downward. 9 On the Moving Average worksheet calculate a moving average for every three months to determine whether there is an upward or downward trend over the course of the year. Open the Data Analysis ToolPak, select Moving Average, and use the data in B2:B13 as the Input Range. Use 3 as the interval and C2 as the Output Range. Include a chart in the output and edit the chart title to Moving Sales Average. Edit the vertical axis label to read Sales. A B C D E F G dom Random Sample Number CustomerlD 1 2 3 4 5 6 7 8 9 10 1 Customers on 5/11/2019 2 CustomerID RAND 3 CU-0128 4 CU-0137 5 CU-0153 6 CU-0132 7 CU-0156 8 CU-0139 9 CU-0151 10 CU-0142 11 CU-0130 12 CU-0129 13 CU-0154 14 CU-0124 15 CU-0126 16 CU-0152 17 CU-0144 18 CU-0150 19 CU-0149 20 CU-0136 21 CU-0141 22 CU-0135 23 CU-0147 24 CU-0138 25 CU-0133 26 CU-0125 27 CU-0146 28 CU-0127 29 CU-0145 30 CU-0131 31 CU-0140 32 CU-0143 33 CU-0155 34 CU-0134 35 CU-0148 36 CU-0123 37 38 39 Random Sample Basic Stats Order Distribution DescriptiveStats B C D E F G H Mean Median Mode A Order Number 0001239 0001262 0001254 0001257 0001258 0001256 0001245 0001246 0001263 Order Type Quantity Sold face 13 body 13 body 11 foot 14 body 15 face 11 body 11 foot 12 Min Max foot 9 Range Variance Standard Deviation face 7 face 13 3 8 13 13 9 9 9 15 10 15 0001261 0001241 0001248 0001240 0001264 0001265 0001266 0001260 0001250 0001244 0001259 0001234 0001251 0001243 0001237 0001249 0001238 0001267 0001255 0001235 0001252 0001236 0001242 0001247 0001253 10 body body face foot face body body body face body face body face foot foot foot foot face body body foot body face 16 18 16 17 16 16 17 17 18 18 18 25 RandomSample Basic Stats OrderDistribution DescriptiveStats A B C D E F G H I J Number of Cases 41 Frequency (Count) 1 Bin 2 10 WN 3 34 20 4 30 40 Order Number 1292 1871 1717 1057 1104 1655 1201 1069 1685 1286 1748 23 11 37 48 30 10 45 36 22 15 47 lai th ai ec ss 1955 1781 1799 2020 1813 1782 3 # 1 10 1818 5 6 7 8 9 10 11 12 13 14 15 16 17 18 19 20 21 22 23 24 25 26 27 28 29 30 31 32 33 34 35 36 37 38 46 31 38 40 18 12 20 38 49 34 10 37 25 47 44 1610 1756 1287 1802 1305 1215 1554 1188 1011 1806 1907 e 1 Random Sample Basic Stats Order Distribution DescriptiveStats + A B D E F G H I J 1 Month 2 January 3 February 4 March 5 April 6 May 7 June 8 July 9 August 10 September 11 October 12 November 13 December 14 Sales Revenue $13,050.00 $14,462.00 $17,048.00 $12,561.00 $15,566.00 $13,928.00 $16,610.00 $16,155.00 $13,185.00 $14,496.00 $16,885.00 $14,817.00 15 16 17 18 19 20 21 22 23 24 25 26 27 28 29 30 31 32 33 34 35 36 37 38 RandomSample Basic Stats OrderDistribution Descriptive Stats + A1 x fx Customer ID A B B D D E F G H H I J L M Total Items Purchased 32 31 47 53 36 51 23 53 43 35 1 2 3 4 5 6 7 8 9 10 11 12 13 14 15 16 17 18 19 20 21 22 49 33 56 48 Customer ID CUO-8608 CUO-2324 CUO-4777 CUO-7803 CUO-8590 CUO-5551 CUO-4671 CUO-409 CUO-3644 CUO-2024 CUO-8396 CUO-2452 CUO-8541 CUO-2144 CUO-3053 CUO-5934 CUO-1643 CUO-5045 CUO-5150 CUO-5423 CUO-3796 CUO-3024 CUO-5228 CUO-5600 CUO-3378 CUO-8229 CUO-3125 CUO-2686 CUO-858 - CUO-5939 63 74 39 70 24 38 56 23 32 81 24 25 26 27 28 29 30 70 43 49 75 70 75 28 31 32 33 34 35 36 Random Sample Basic Stats OrderDistribution DescriptiveStats Histogram Moving Average A B D E F G . T J K L M 1 Month Sales Revenue Moving Average 2 January $13,050.00 3 February $14,462.00 4 March $17,048.00 5 April $12,561.00 6 May $15,566.00 7 June $13,928.00 8 July $16,610.00 9 August $16,155.00 10 September $13,185.00 11 October $14,496.00 12 November $16,885.00 13 December $14,817.00 14 15 16 17 18 19 20 21 22 23 24 25 26 27 28 29 30 31 32 33 34 35 36 37 38 39 RandomSample Basic Stats OrderDistribution Descriptive Stats Histogram Moving Average 2 Randomness in selecting a sample from a population is crucial in conducting effective and accurate statistical analyses. The RAND function in Excel is one method that can help in creating a random sample. On the RandomSample worksheet use the RAND function to generate 34 random values. Start your calculations in cell B3 and copy the function down to B36. Sort the data in ascending order. Select the first 10 Customer IDs. Copy and paste the Customer IDs to cells E3:E12. 3 Excel has many built-in functions that can be used to conduct basic statistical analysis on data. Knowledge of how to use even the most basic statistical functions can increase your understanding of the data and enable better decision making. Navigate to the BasicStats worksheet. Use the data provided in column C to calculate the mean, median, and mode. Place the mean calculation in cell G2, the median in cell G3, and the mode in cell G4. 4 Calculating the range, variance, and standard deviation of a data set is used to determine the dispersion of a data set. Knowing how a data set is dispersed can provide a better understanding of the data than the mean, median, and mode alone. Using the data on the BasicStats worksheets and in column C, calculate the range, variance, and standard deviation of the random sample data set in order to understand how the data is distributed. Place the minimum in G6, the maximum in G7, the range in G9, the sample variance in G10, and the sample standard deviation in G11. A box and whisker chart provides an efficient method of visualizing the distribution of your data and highlights outliers as part of the chart. Visualize the distribution of the quantities sold in the random sample of data for which you previously calculated statistics. Using the data in cells B1:C35 create a Box and Whisker chart. Change the chart title to Distribution of Orders and move the chart so that it covers cells 12:P15. 5 6 The FREQUENCY function in Excel is an array function that creates a frequency distribution that calculates how often values occur within a bin. An array function can perform multiple calculations on one or more items in an array. Array functions look different from other functions because curly brackets {} are required for the function to calculate correctly. On the Order Distribution worksheet use the FREQUENCY array function to group the number of cases ordered into the bins provided in column D. Place the calculations in cells E2:E6 and add the label More in D6. 7 The Data Analysis add-in allows you to conduct a variety of statistical analyses with ease. For example, instead of typing out individual functions to calculate the mean, median, mode, variance, and standard deviation, you can generate all of those and more using the Analysis ToolPak. Install the Data Analysis add-into analyze the data on the DescriptiveStats worksheet. Generate descriptive statistics on the data in cells B1:B13. Use the Label in cell B1 and use cell E1 as the Output cell for the statistics. Resize the columns as needed. 8 A histogram is a statistical graph that summarizes the distribution of data and how the data fits into defined bins. On the Histogram worksheet, create a histogram to visualize the distribution of data in cells A1:B31. Change the number of bins in the histogram to 10 and type Histogram of Items Purchased for the chart title. Move the histogram to cover cells E4:K18. Moving averages can be useful in spotting trends over a period of time by smoothing out any fluctuations that may occur during each consecutive interval. Moving average data can be used to create charts that show whether the value is trending upward or downward. 9 On the Moving Average worksheet calculate a moving average for every three months to determine whether there is an upward or downward trend over the course of the year. Open the Data Analysis ToolPak, select Moving Average, and use the data in B2:B13 as the Input Range. Use 3 as the interval and C2 as the Output Range. Include a chart in the output and edit the chart title to Moving Sales Average. Edit the vertical axis label to read Sales. A B C D E F G dom Random Sample Number CustomerlD 1 2 3 4 5 6 7 8 9 10 1 Customers on 5/11/2019 2 CustomerID RAND 3 CU-0128 4 CU-0137 5 CU-0153 6 CU-0132 7 CU-0156 8 CU-0139 9 CU-0151 10 CU-0142 11 CU-0130 12 CU-0129 13 CU-0154 14 CU-0124 15 CU-0126 16 CU-0152 17 CU-0144 18 CU-0150 19 CU-0149 20 CU-0136 21 CU-0141 22 CU-0135 23 CU-0147 24 CU-0138 25 CU-0133 26 CU-0125 27 CU-0146 28 CU-0127 29 CU-0145 30 CU-0131 31 CU-0140 32 CU-0143 33 CU-0155 34 CU-0134 35 CU-0148 36 CU-0123 37 38 39 Random Sample Basic Stats Order Distribution DescriptiveStats B C D E F G H Mean Median Mode A Order Number 0001239 0001262 0001254 0001257 0001258 0001256 0001245 0001246 0001263 Order Type Quantity Sold face 13 body 13 body 11 foot 14 body 15 face 11 body 11 foot 12 Min Max foot 9 Range Variance Standard Deviation face 7 face 13 3 8 13 13 9 9 9 15 10 15 0001261 0001241 0001248 0001240 0001264 0001265 0001266 0001260 0001250 0001244 0001259 0001234 0001251 0001243 0001237 0001249 0001238 0001267 0001255 0001235 0001252 0001236 0001242 0001247 0001253 10 body body face foot face body body body face body face body face foot foot foot foot face body body foot body face 16 18 16 17 16 16 17 17 18 18 18 25 RandomSample Basic Stats OrderDistribution DescriptiveStats A B C D E F G H I J Number of Cases 41 Frequency (Count) 1 Bin 2 10 WN 3 34 20 4 30 40 Order Number 1292 1871 1717 1057 1104 1655 1201 1069 1685 1286 1748 23 11 37 48 30 10 45 36 22 15 47 lai th ai ec ss 1955 1781 1799 2020 1813 1782 3 # 1 10 1818 5 6 7 8 9 10 11 12 13 14 15 16 17 18 19 20 21 22 23 24 25 26 27 28 29 30 31 32 33 34 35 36 37 38 46 31 38 40 18 12 20 38 49 34 10 37 25 47 44 1610 1756 1287 1802 1305 1215 1554 1188 1011 1806 1907 e 1 Random Sample Basic Stats Order Distribution DescriptiveStats + A B D E F G H I J 1 Month 2 January 3 February 4 March 5 April 6 May 7 June 8 July 9 August 10 September 11 October 12 November 13 December 14 Sales Revenue $13,050.00 $14,462.00 $17,048.00 $12,561.00 $15,566.00 $13,928.00 $16,610.00 $16,155.00 $13,185.00 $14,496.00 $16,885.00 $14,817.00 15 16 17 18 19 20 21 22 23 24 25 26 27 28 29 30 31 32 33 34 35 36 37 38 RandomSample Basic Stats OrderDistribution Descriptive Stats + A1 x fx Customer ID A B B D D E F G H H I J L M Total Items Purchased 32 31 47 53 36 51 23 53 43 35 1 2 3 4 5 6 7 8 9 10 11 12 13 14 15 16 17 18 19 20 21 22 49 33 56 48 Customer ID CUO-8608 CUO-2324 CUO-4777 CUO-7803 CUO-8590 CUO-5551 CUO-4671 CUO-409 CUO-3644 CUO-2024 CUO-8396 CUO-2452 CUO-8541 CUO-2144 CUO-3053 CUO-5934 CUO-1643 CUO-5045 CUO-5150 CUO-5423 CUO-3796 CUO-3024 CUO-5228 CUO-5600 CUO-3378 CUO-8229 CUO-3125 CUO-2686 CUO-858 - CUO-5939 63 74 39 70 24 38 56 23 32 81 24 25 26 27 28 29 30 70 43 49 75 70 75 28 31 32 33 34 35 36 Random Sample Basic Stats OrderDistribution DescriptiveStats Histogram Moving Average A B D E F G . T J K L M 1 Month Sales Revenue Moving Average 2 January $13,050.00 3 February $14,462.00 4 March $17,048.00 5 April $12,561.00 6 May $15,566.00 7 June $13,928.00 8 July $16,610.00 9 August $16,155.00 10 September $13,185.00 11 October $14,496.00 12 November $16,885.00 13 December $14,817.00 14 15 16 17 18 19 20 21 22 23 24 25 26 27 28 29 30 31 32 33 34 35 36 37 38 39 RandomSample Basic Stats OrderDistribution Descriptive Stats Histogram Moving Average


