Question: 2. Ratio analysis for the ratios shown on Table 1 in the Guide to Case Analysis (CA) of the textbook: Deliverables Macy's Inc. Case Study
2. Ratio analysis for the ratios shown on Table 1 in the Guide to Case Analysis (CA) of the textbook: Deliverables Macy's Inc. Case Study Historical Financial Analysis Assignment
a. Profitability ratios
b. Liquidity ratios
c. Leverage ratios
d. Activity ratios
e. Price-to-earnings ratio
f. The changes between years are included in the calculations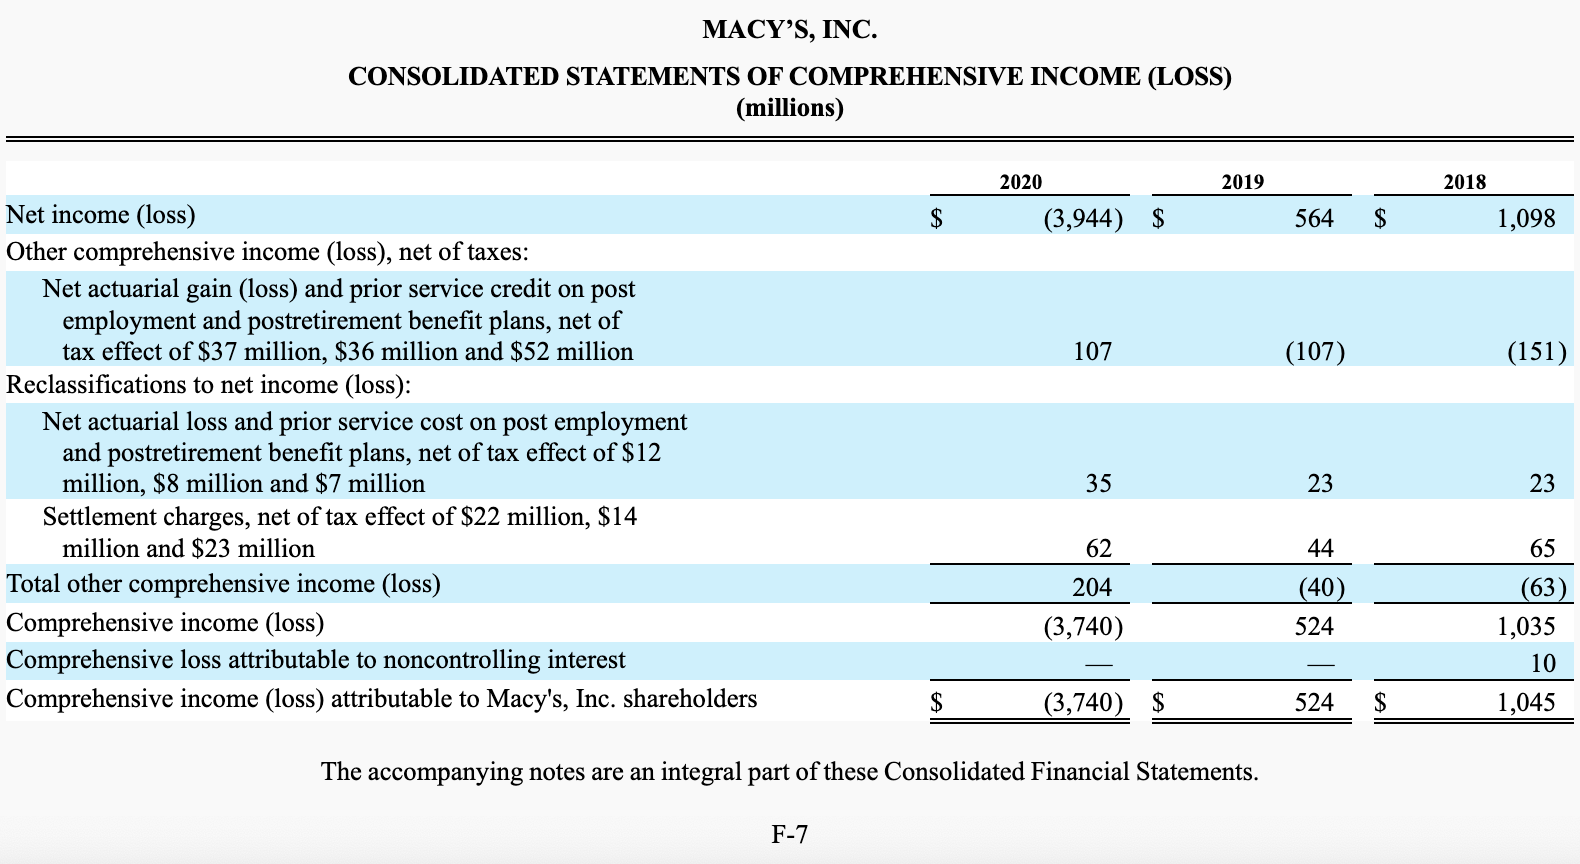 The changes between years are included in the calculations.
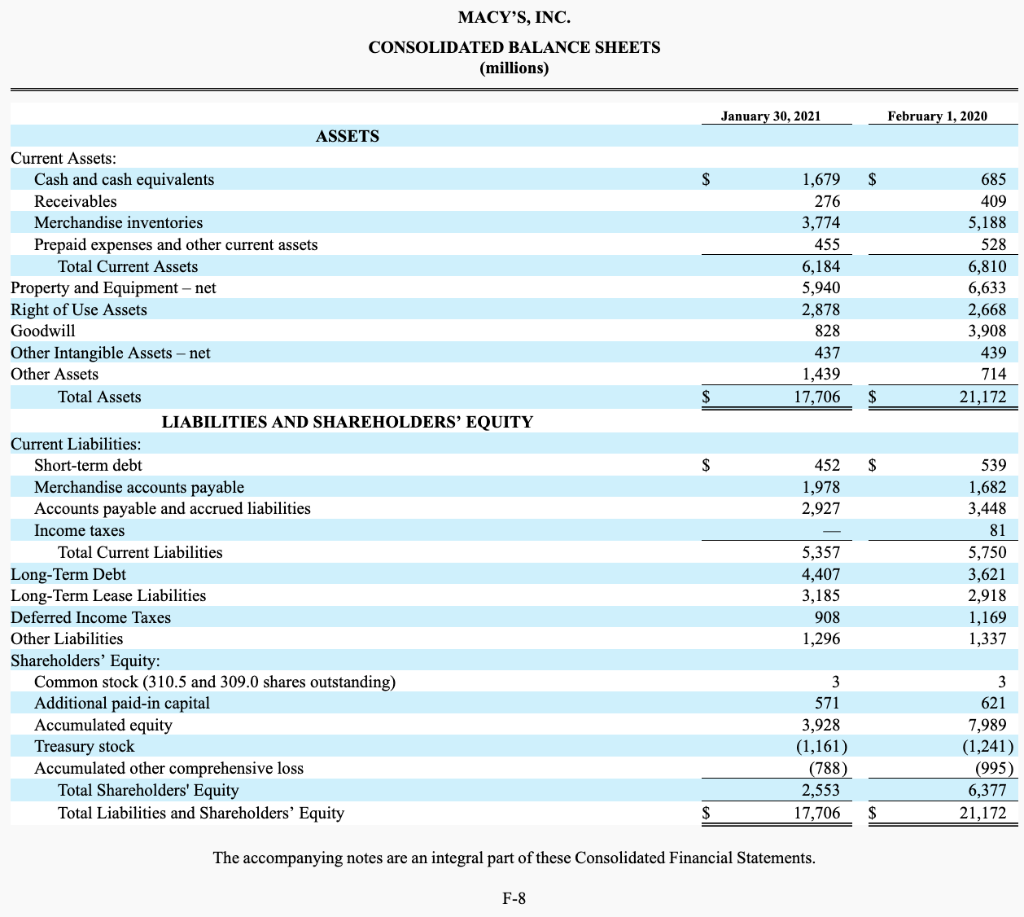
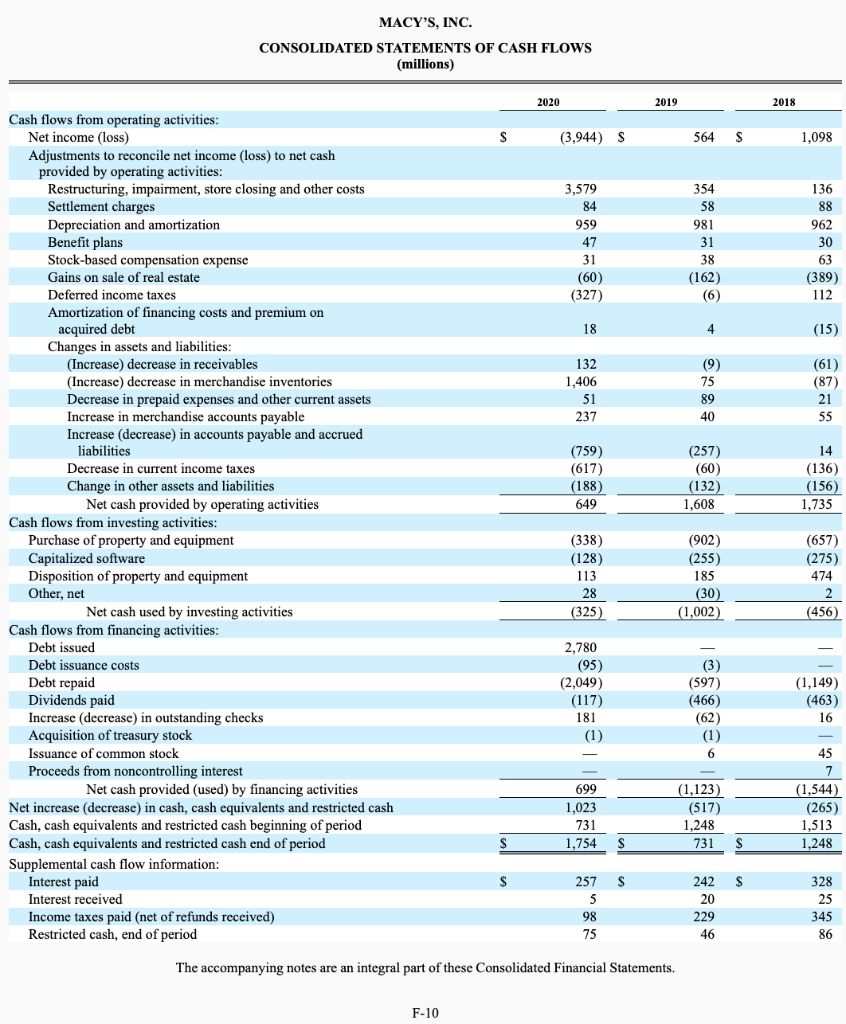
MACY'S, INC. CONSOLIDATED STATEMENTS OF COMPREHENSIVE INCOME (LOSS) (millions) 2020 2019 2018 (3,944) $ 564 $ 1,098 107 (107) (151) Net income (loss) Other comprehensive income (loss), net of taxes: Net actuarial gain (loss) and prior service credit on post employment and postretirement benefit plans, net of tax effect of $37 million, $36 million and $52 million Reclassifications to net income (loss): Net actuarial loss and prior service cost on post employment and postretirement benefit plans, net of tax effect of $12 million, $8 million and $7 million Settlement charges, net of tax effect of $22 million, $14 million and $23 million Total other comprehensive income (loss) Comprehensive income (loss) Comprehensive loss attributable to noncontrolling interest Comprehensive income (loss) attributable to Macy's, Inc. shareholders 35 23 23 62 65 204 44 (40) 524 (63) (3,740) 1,035 10 1,045 $ (3,740) $ 524 The accompanying notes are an integral part of these Consolidated Financial Statements. F-7 MACY'S, INC. CONSOLIDATED BALANCE SHEETS (millions) January 30, 2021 February 1, 2020 $ $ 1,679 276 3,774 455 6,184 5,940 2,878 828 437 1,439 17,706 685 409 5,188 528 6,810 6,633 2,668 3,908 439 714 21,172 $ $ S $ ASSETS Current Assets: Cash and cash equivalents Receivables Merchandise inventories Prepaid expenses and other current assets Total Current Assets Property and Equipment - net Right of Use Assets Goodwill Other Intangible Assets net Other Assets Total Assets LIABILITIES AND SHAREHOLDERS' EQUITY Current Liabilities: Short-term debt Merchandise accounts payable Accounts payable and accrued liabilities Income taxes Total Current Liabilities Long-Term Debt Long-Term Lease Liabilities Deferred Income Taxes Other Liabilities Shareholders' Equity: Common stock (310.5 and 309.0 shares outstanding) Additional paid-in capital Accumulated equity Treasury stock Accumulated other comprehensive loss Total Shareholders' Equity Total Liabilities and Shareholders' Equity 452 1,978 2,927 5,357 4,407 3,185 908 1,296 539 1,682 3,448 81 5,750 3,621 2,918 1,169 1,337 3 571 3,928 (1,161) (788) 2,553 17,706 3 621 7,989 (1,241) (995) 6,377 21,172 $ The accompanying notes are an integral part of these Consolidated Financial Statements. F-8 MACY'S, INC. CONSOLIDATED STATEMENTS OF CASH FLOWS (millions) 2020 2019 2018 S (3,944) S 564 S 1.098 3,579 84 959 47 31 (60) (327) 354 58 981 31 38 (162) (6 136 88 962 30 63 (389) 112 18 4 (15) 132 1,406 51 237 (9) 75 89 40 (61) (87) 21 55 (759) (617) (188) 649 (257) (60) (132) 1,608 14 (136) (156) 1,735 Cash flows from operating activities: Net income (loss) Adjustments to reconcile net income (loss) to net cash provided by operating activities: Restructuring, impairment, store closing and other costs Settlement charges Depreciation and amortization Benefit plans Stock-based compensation expense Gains on sale of real estate Deferred income taxes Amortization of financing costs and premium on acquired debt Changes in assets and liabilities: (Increase) decrease in receivables (Increase) decrease in merchandise inventories Decrease in prepaid expenses and other current assets Increase in merchandise accounts payable Increase (decrease) in accounts payable and accrued liabilities Decrease in current income taxes Change in other assets and liabilities Net cash provided by operating activities Cash flows from investing activities: Purchase of property and equipment Capitalized software Disposition of property and equipment Other, net Net cash used by investing activities Cash flows from financing activities: Debt issued Debt issuance costs Debt repaid Dividends paid Increase (decrease) in outstanding checks Acquisition of treasury stock Issuance of common stock Proceeds from noncontrolling interest Net cash provided (used) by financing activities Net increase (decrease) in cash, cash equivalents and restricted cash Cash, cash equivalents and restricted cash beginning of period Cash, cash equivalents and restricted cash end of period Supplemental cash flow information: Interest paid Interest received Income taxes paid (net of refunds received) Restricted cash, end of period (338) (128) 113 28 (325) (902) (255) 185 (30) (1,002) (657) (275) 474 (456) 2,780 (95) (2,049) (117) 181 (1) (1,149) (3) (597) (466) (62) (1) 6 (463) 16 699 1,023 731 1,754 (1,123) (517) 1.248 731 45 7 (1,544) (265) 1,513 1,248 S S s S 257 5 98 75 242 20 229 46 328 25 345 86 The accompanying notes are an integral part of these Consolidated Financial Statements. F-10


