

Question: 2 . Real versus nominal GDP Consider a simple economy that produces two goods: beers and donuts. The following table shows the prices and quantities
2 . Real versus nominal GDP
Consider a simple economy that produces two goods: beers and donuts. The following table shows the prices and quantities of the goods over a three-year period.
| Year | Beers | Donuts | ||
|---|---|---|---|---|
| Price | Quantity | Price | Quantity | |
| (Dollars per beer) | (Number of beers) | (Dollars per donut) | (Number of donuts) | |
| 2016 | 2 | 245 | 2 | 180 |
| 2017 | 4 | 130 | 2 | 195 |
| 2018 | 2 | 115 | 2 | 155 |
Use the information from the preceding table to fill in the following table.
| Year | Nominal GDP | Real GDP | GDP Deflator |
|---|---|---|---|
| (Dollars) | (Base year 2016, dollars) | ||
| 2016 | |||
| 2017 | |||
| 2018 |
From 2017 to 2018, nominal GDP , and real GDP .
The inflation rate in 2018 was .
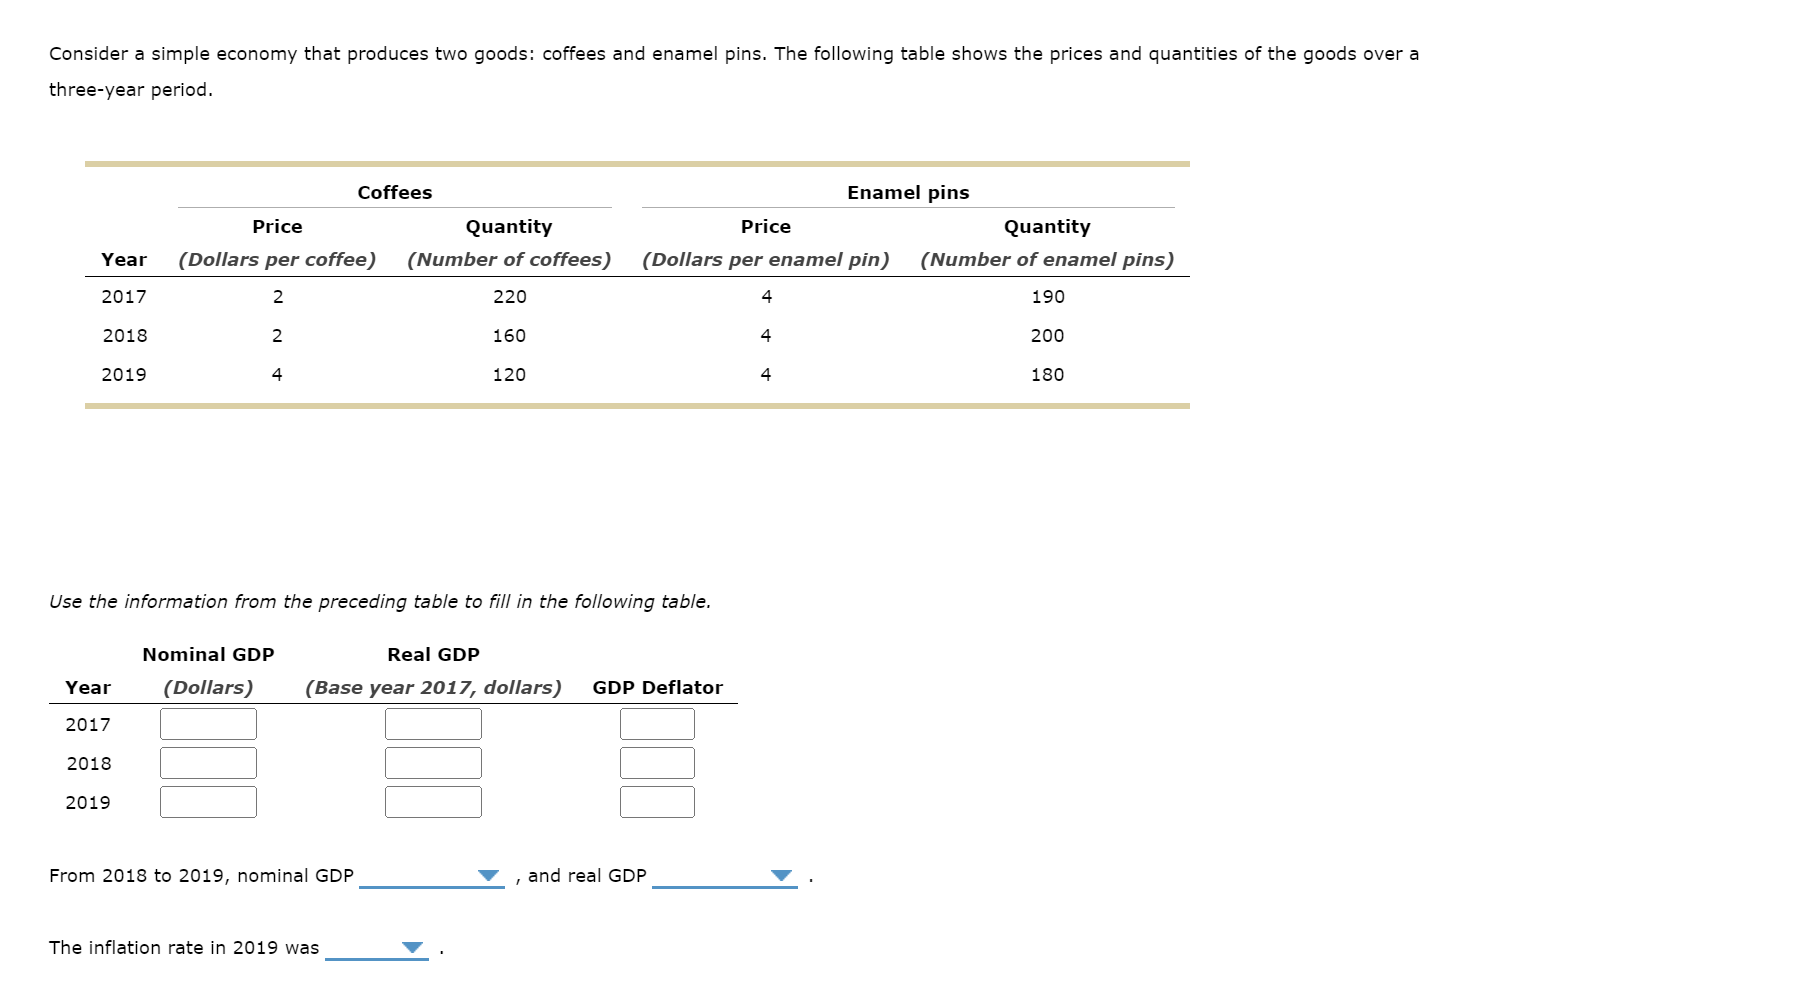
Consider a simple economy that produces two goods: coffees and enamel pins. The following table shows the prices and quantities of the goods over a three-year period. Coffees Enamel pins Price Quantity Price Quantity Year (Dollars per coffee) (Number of coffees) (Dollars per enamel pin) (Number of enamel pins) 2017 2 220 4 190 2018 2 160 4 200 2019 4 120 4 180 Use the information from the preceding table to Fill in the following table, Nominal GDP Real GDP Year (Dollars) (Base year 2017, dollars) GDP Deflator From 2018 to 2019, nominal GDP Y , and real GDP Y . The inflation rate in 2019 was '7
Step by Step Solution
There are 3 Steps involved in it

Get step-by-step solutions from verified subject matter experts