

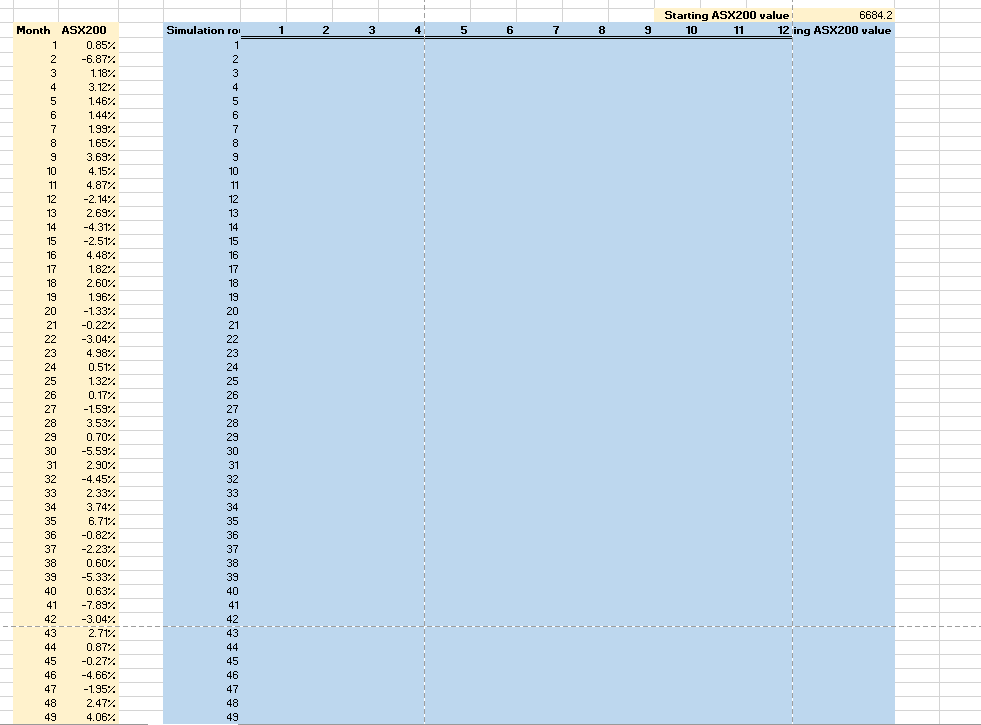
Question: 2. Refer to the Simulation worksheet. This worksheet contains the historical monthly returns of the ASX200 stock index. Using the data provided, compute the: (a)
![the: (a) [1 mark] mean monthly returns of the ASX200 index and](https://dsd5zvtm8ll6.cloudfront.net/si.experts.images/questions/2024/10/6700dc0ad4cbc_5786700dc0a79ea4.jpg)
2. Refer to the "Simulation" worksheet. This worksheet contains the historical monthly returns of the ASX200 stock index. Using the data provided, compute the: (a) [1 mark] mean monthly returns of the ASX200 index and (b) (1 mark] standard deviation of the ASX200 monthly returns. Let the initial value of the ASX200 index be 6684.20. Using the statistics computed in parts (a) and (b), (c) [15 marks] Use the Monte Carlo method to simulate 1000 values of the ASX200 index after 12 months. You must provide formulas in the cells of the array E9:Q1008. Otherwise, you will receive no credit for this part. Based on your simulated ASX200 index values (after 12 months), (d) [5 marks) Write a formula in cell K2 that computes the proportion of those values that are above 8500. Overall, (e) [3 marks] Provide one limitation/shortcoming/caveat of your Monte Carlo simula- tion. Starting ASX200 value 6684.2 10 11 12 ing ASX200 value Month ASX200 1 2 3 4 5 6 7 8 9 Simulation rol 1 1 0.85% 2 -6.87% 2 3 1.18% % 3 4 3.12% 4 5 5 6 1.46% 1.44% 1.99% 6 8 1.65% 8 9 3.69% 9 10 4.15% 10 11 4.87% 11 12 -2.14% 12 13 2.697 13 14 -4.31% 14 15 -2.51% 15 16 4.48% 16 17 1.82% 17 18 2.60% 18 19 1.96%. 19 20 -1.33% 20 21 -0.22% 21 22 -3.04% 22 23 4.98% 23 24 0.51%. 24 25 1.32% 25 26 0.17% 26 27 -1.59% 27 28 3.53% 28 29 0.70% 29 30 -5.59%. 30 31 2.90% 31 32 -4.45%. 32 33 2.33% "Ba88888%87%88%%H&HFS%F8% 33 34 3.74% 34 35 6.712 35 36 36 -0.82% -2.23%. 37 37 38 0.60% 38 39 -5.33% 39 40 0.63% 40 41 -7.897. 41 42 -3.04% 42 43 2.712 43 44 44 45 0.87% -0.27%. % -4.66%. 45 46 46 47 -1.95%. 47 48 2.47% 48 49 4.06% 49 50 2.95% 50 51 -2.60% 51 52 3.08% 52 53 -1.01% 53 54 0.36% 54 55 55 -4.33% 4.81% 56 56 57 3.31% 57 58 -1.24% 58 59 59 1.64%. 3.53% 60 60 61 -0.04% 61 62 -2.79% 62 63 0.13% 63 64 -0.55%. 64 65 0.47% 65 66 0.00% 66 67 2.96% 67 68 1.48% 68 69 1.42% 69 -0.28% 70 1 -1.08% 72 -3.28% 72 73 3.09% 73 74 0.89% 74 mm&BE8%88mm&B88m88mmma88w8%m%8mm%88%5%8mm 75 75 3.26% 0.74% m5%8B%m%Bmag888mnBTBmm888885%88%%8mm 76 76 1.47% 78 -1.37% 78 79 -7.617 79 80 -2.212 80 81 -0.13% 81 82 2.78% 82 83 6.49% 83 84 84 0.82% 0.58% 85 85 86 1.50% 86 87 3.99% 87 88 1.50% 89 -2.48% 89 90 1.92% 90 91 -1.592 91 92 3.16% 92 93 -2.14% 94 4.19% 95 -7.73%. 96 -18.202 96 97 4.68% 97 98 98 4.96% 1.64% 99 100 0.25% 99 100 101 101 3.02% 2. Refer to the "Simulation" worksheet. This worksheet contains the historical monthly returns of the ASX200 stock index. Using the data provided, compute the: (a) [1 mark] mean monthly returns of the ASX200 index and (b) (1 mark] standard deviation of the ASX200 monthly returns. Let the initial value of the ASX200 index be 6684.20. Using the statistics computed in parts (a) and (b), (c) [15 marks] Use the Monte Carlo method to simulate 1000 values of the ASX200 index after 12 months. You must provide formulas in the cells of the array E9:Q1008. Otherwise, you will receive no credit for this part. Based on your simulated ASX200 index values (after 12 months), (d) [5 marks) Write a formula in cell K2 that computes the proportion of those values that are above 8500. Overall, (e) [3 marks] Provide one limitation/shortcoming/caveat of your Monte Carlo simula- tion. Starting ASX200 value 6684.2 10 11 12 ing ASX200 value Month ASX200 1 2 3 4 5 6 7 8 9 Simulation rol 1 1 0.85% 2 -6.87% 2 3 1.18% % 3 4 3.12% 4 5 5 6 1.46% 1.44% 1.99% 6 8 1.65% 8 9 3.69% 9 10 4.15% 10 11 4.87% 11 12 -2.14% 12 13 2.697 13 14 -4.31% 14 15 -2.51% 15 16 4.48% 16 17 1.82% 17 18 2.60% 18 19 1.96%. 19 20 -1.33% 20 21 -0.22% 21 22 -3.04% 22 23 4.98% 23 24 0.51%. 24 25 1.32% 25 26 0.17% 26 27 -1.59% 27 28 3.53% 28 29 0.70% 29 30 -5.59%. 30 31 2.90% 31 32 -4.45%. 32 33 2.33% "Ba88888%87%88%%H&HFS%F8% 33 34 3.74% 34 35 6.712 35 36 36 -0.82% -2.23%. 37 37 38 0.60% 38 39 -5.33% 39 40 0.63% 40 41 -7.897. 41 42 -3.04% 42 43 2.712 43 44 44 45 0.87% -0.27%. % -4.66%. 45 46 46 47 -1.95%. 47 48 2.47% 48 49 4.06% 49 50 2.95% 50 51 -2.60% 51 52 3.08% 52 53 -1.01% 53 54 0.36% 54 55 55 -4.33% 4.81% 56 56 57 3.31% 57 58 -1.24% 58 59 59 1.64%. 3.53% 60 60 61 -0.04% 61 62 -2.79% 62 63 0.13% 63 64 -0.55%. 64 65 0.47% 65 66 0.00% 66 67 2.96% 67 68 1.48% 68 69 1.42% 69 -0.28% 70 1 -1.08% 72 -3.28% 72 73 3.09% 73 74 0.89% 74 mm&BE8%88mm&B88m88mmma88w8%m%8mm%88%5%8mm 75 75 3.26% 0.74% m5%8B%m%Bmag888mnBTBmm888885%88%%8mm 76 76 1.47% 78 -1.37% 78 79 -7.617 79 80 -2.212 80 81 -0.13% 81 82 2.78% 82 83 6.49% 83 84 84 0.82% 0.58% 85 85 86 1.50% 86 87 3.99% 87 88 1.50% 89 -2.48% 89 90 1.92% 90 91 -1.592 91 92 3.16% 92 93 -2.14% 94 4.19% 95 -7.73%. 96 -18.202 96 97 4.68% 97 98 98 4.96% 1.64% 99 100 0.25% 99 100 101 101 3.02%
Step by Step Solution
There are 3 Steps involved in it

Get step-by-step solutions from verified subject matter experts