

Question: 2) Regression Analysis: Using the Dataset P10_20 perform multiple linear regression analyses using various possible independent variables to predict the number of weekly riders. Based
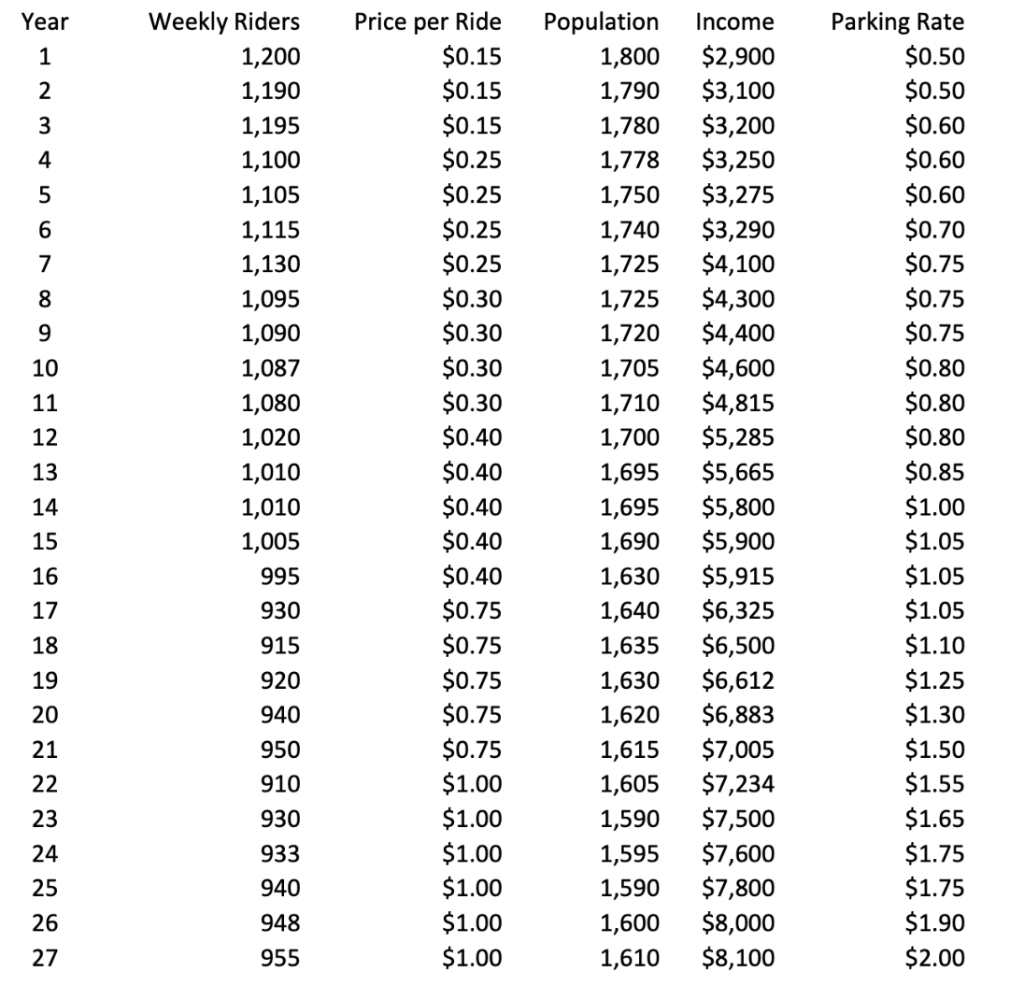
2) Regression Analysis: Using the Dataset P10_20 perform multiple linear regression analyses using various possible independent variables to predict the number of weekly riders. Based on your analyses, what's the best equation to use and why? Year 123456 7 8 9 10 11 12 13 14 15 16 17 18 19 20 21 22 22222 23 24 25 26 27 Weekly Riders 1,200 1,190 1,195 1,100 1,105 1,115 1,130 1,095 1,090 1,087 1,080 1,020 1,010 1,010 1,005 995 930 915 920 940 950 910 930 933 940 948 955 Price per Ride $0.15 $0.15 $0.15 $0.25 $0.25 $0.25 $0.25 $0.30 $0.30 $0.30 $0.30 $0.40 $0.40 $0.40 $0.40 $0.40 $0.75 $0.75 $0.75 $0.75 $0.75 $1.00 $1.00 $1.00 $1.00 $1.00 $1.00 Population Income 1,800 $2,900 1,790 $3,100 1,780 $3,200 1,778 $3,250 1,750 $3,275 1,740 $3,290 1,725 $4,100 1,725 $4,300 1,720 $4,400 1,705 $4,600 1,710 $4,815 1,700 $5,285 1,695 $5,665 1,695 $5,800 1,690 $5,900 1,630 $5,915 1,640 $6,325 1,635 $6,500 1,630 $6,612 1,620 $6,883 1,615 $7,005 1,605 $7,234 1,590 $7,500 1,595 $7,600 1,590 $7,800 1,600 $8,000 1,610 $8,100 Parking Rate $0.50 $0.50 $0.60 $0.60 $0.60 $0.70 $0.75 $0.75 $0.75 $0.80 $0.80 $0.80 $0.85 $1.00 $1.05 $1.05 $1.05 $1.10 $1.25 $1.30 $1.50 $1.55 $1.65 $1.75 $1.75 $1.90 $2.00 2) Regression Analysis: Using the Dataset P10_20 perform multiple linear regression analyses using various possible independent variables to predict the number of weekly riders. Based on your analyses, what's the best equation to use and why? Year 123456 7 8 9 10 11 12 13 14 15 16 17 18 19 20 21 22 22222 23 24 25 26 27 Weekly Riders 1,200 1,190 1,195 1,100 1,105 1,115 1,130 1,095 1,090 1,087 1,080 1,020 1,010 1,010 1,005 995 930 915 920 940 950 910 930 933 940 948 955 Price per Ride $0.15 $0.15 $0.15 $0.25 $0.25 $0.25 $0.25 $0.30 $0.30 $0.30 $0.30 $0.40 $0.40 $0.40 $0.40 $0.40 $0.75 $0.75 $0.75 $0.75 $0.75 $1.00 $1.00 $1.00 $1.00 $1.00 $1.00 Population Income 1,800 $2,900 1,790 $3,100 1,780 $3,200 1,778 $3,250 1,750 $3,275 1,740 $3,290 1,725 $4,100 1,725 $4,300 1,720 $4,400 1,705 $4,600 1,710 $4,815 1,700 $5,285 1,695 $5,665 1,695 $5,800 1,690 $5,900 1,630 $5,915 1,640 $6,325 1,635 $6,500 1,630 $6,612 1,620 $6,883 1,615 $7,005 1,605 $7,234 1,590 $7,500 1,595 $7,600 1,590 $7,800 1,600 $8,000 1,610 $8,100 Parking Rate $0.50 $0.50 $0.60 $0.60 $0.60 $0.70 $0.75 $0.75 $0.75 $0.80 $0.80 $0.80 $0.85 $1.00 $1.05 $1.05 $1.05 $1.10 $1.25 $1.30 $1.50 $1.55 $1.65 $1.75 $1.75 $1.90 $2.00
Step by Step Solution
There are 3 Steps involved in it

Get step-by-step solutions from verified subject matter experts