

Question: 2 Remember, the expected value of a probability distribution is a statistical measure of the average (mean) value expected to occur during all possible circumstances.
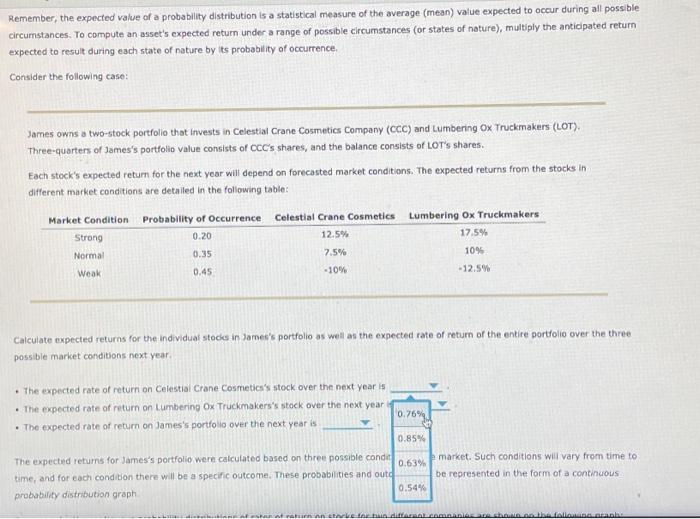
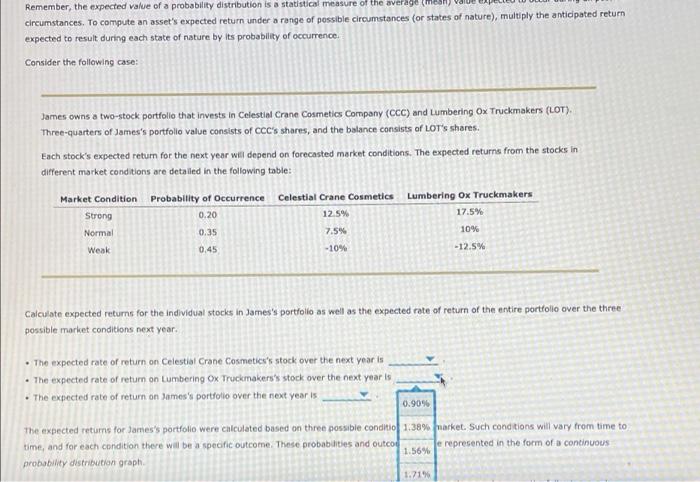
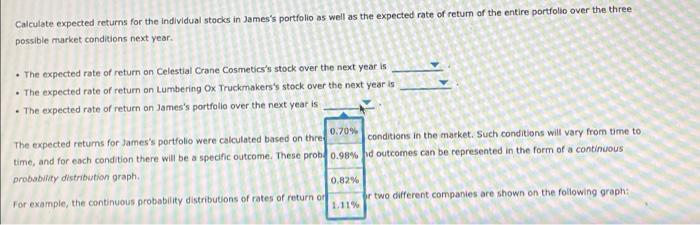
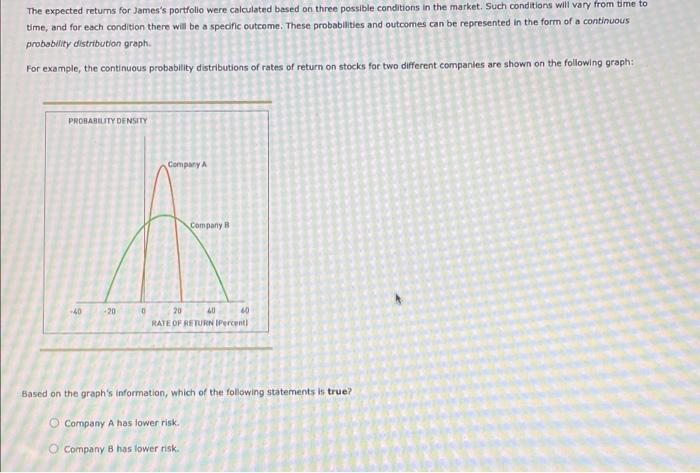
Remember, the expected value of a probability distribution is a statistical measure of the average (mean) value expected to occur during all possible circumstances. To compute an asset's expected return under a range of possible circumstances (or states of nature), multiply the anticipated return expected to result during each state of nature by its probability of occurrence, Consider the following case: James owns a two-stock portfolio that invests in Celestial Crane Cosmetics Company (CCC) and Lumbering ox Truckmakers (LOT). Three-quarters of James's portfolio value consists of CCC's shares, and the balance consists of LOT's shares. Each stock's expected return for the next year will depend on forecasted market conditions. The expected returns from the stocks in different market conditions are detailed in the following table: Market Condition Probability of Occurrence Celestial Crane Cosmetics Lumbering Ox Truckmakers Strong 0.20 12.5% 17.5% Normal 0.35 7.5% 10% Weak 0.45 - 10% -12.5% Calculate expected returns for the individual stodes in James's portfolio as well as the expected rate of return of the entire portfolio over the three possible market conditions next year The expected rate of return on Celestial Crane Cosmetics's stock over the next year is . The expected rate of return on Lumbering Ox Truckmakers's stock over the next year 0.76% The expected rate of return on James's portfolio over the next year is 0.85% The expected returns for James's portfolio were calculated based on three possible condit 0.63% time, and for each condition there will be a specific outcome. These probabilities and outd probability distribution graph 0.54% market. Such conditions will vary from time to be represented in the form of a continuous edia Commons at Remember, the expected value of a probability distribution is a statistical measure of the average men) circumstances. To compute an asset's expected return under a range of possible circumstances (or states of nature), multiply the anticipated return expected to result during each state of nature by its probability of occurrence Consider the following case: James owns a two-stock portfolio that invests in Celestial Crane Cosmetics Company (CCC) and Lumbering Ox Truckmakers (LOT) Three-quarters of James's portfolio value consists of CCC's shares, and the balance consists of LOT's shares. Each stock's expected return for the next year will depend on forecasted market conditions. The expected returns from the stocks in different market conditions are detailed in the following table: Market Condition Probability of Occurrence Celestial Crane Cosmetics Lumbering Ox Truckmakers Strong 0.20 12.5% 17.5% Normal 0.35 7.5% 10% Weak 0.45 -10% -12.5% Calculate expected returns for the individual stocks in James's portfolio as well as the expected rate of return of the entire portfolio over the three possible market conditions next year. The expected rate of return on Celestial Crane Cosmetien's stock over the next year is The expected rate of return on tumbering ox Truckmakers's stock over the next year is The expected rate of return on James's portfolio over the next year is 0.9096 The expected returns for James's portfolio were calculated based on three possible conditio 1:38% parket . Such conditions will vary from time to time, and for each condition there will be a specific outcome. These probabilities and outcod Je represented in the form of a continuous 1.56% probability distribution graph 1.71% Calculate expected returns for the individual stocks in James's portfolio as well as the expected rate of retum of the entire portfolio over the three possible market conditions next year. The expected rate of return on Celestial Crane Cosmetics's stock over the next year is The expected rate of return on Lumbering Ox Truckmakers's stock over the next year is The expected rate of return on James's portfolio over the next year is 0.70% The expected returns for James's portfolio were calculated based on the conditions in the market. Such conditions will vary from time to time, and for each condition there will be a specific outcome. These prob0.98% d outcomes can be represented in the form of a continuous probability distribution graph 0.82% For example, the continuous probability distributions of rates of return of ir two different companies are shown on the following graph 1.11% The expected returns for James's portfolio were calculated based on three possible conditions in the market. Such conditions will vary from time time, and for each condition there will be a specific outcome. These probabilities and outcomes can be represented in the form of a continuous probability distribution graph. For example, the continuous probability distributions of rates of return on stocks for two different companies are shown on the following graph: PROBABILITY DENSITY Company Company 40 -20 0 20 40 60 RATE OF RETURN Percent) Based on the graph's Information, which of the following statements is true? Company A has lower risk. Company B has lower risk
Step by Step Solution
There are 3 Steps involved in it

Get step-by-step solutions from verified subject matter experts