

Question: 2. Run a Correlation analysis using EXCEL to explore the relationship between the two companies/stock/prices. Show the output from Excel Interpret the correlation coefficient Do
2. Run a Correlation analysis using EXCEL to explore the relationship between the two companies/stock/prices.
- Show the output from Excel
- Interpret the correlation coefficient
- Do you think combining these two stocks will reduce risk of investment in your portfolio? Explain.
DATA in attached screenshot.
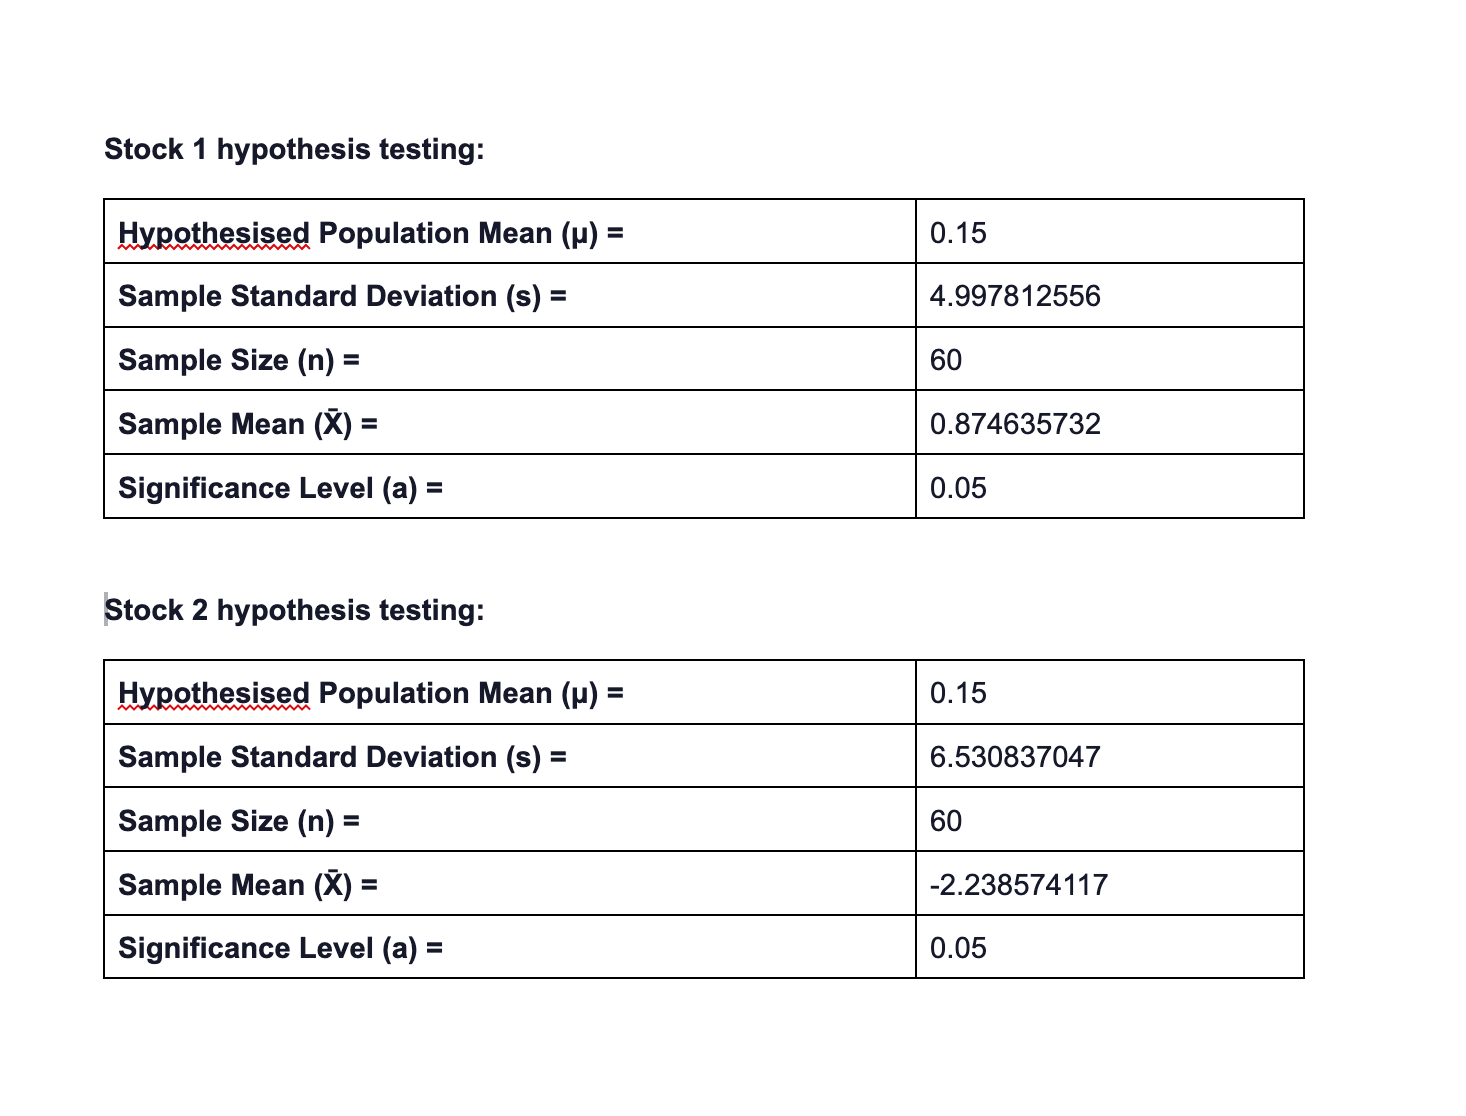
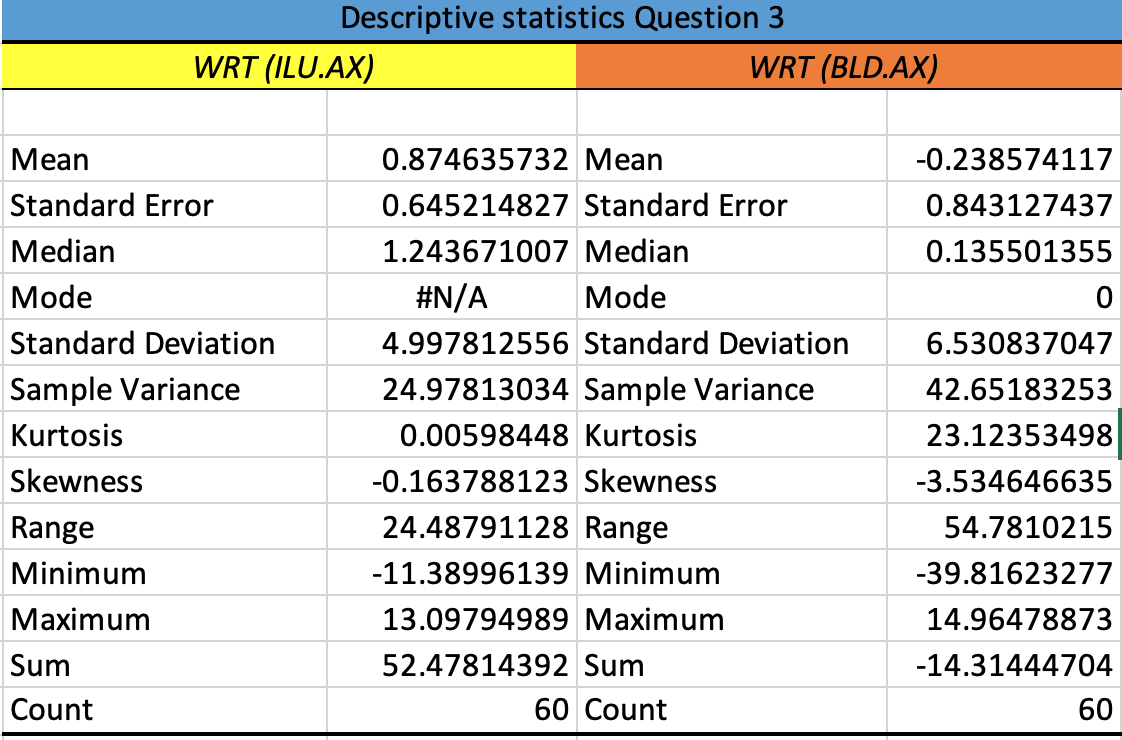
Stock 1 hypothesis testing: Hypothesised Population Mean () = 0.15 Sample Standard Deviation (s) = 4.997812556 Sample Size (n) = 60 Sample Mean (X) = 0.874635732 Significance Level (a) = 0.05 Stock 2 hypothesis testing: Hypothesised Population Mean () = 0.15 Sample Standard Deviation (s) = 6.530837047 Sample Size (n) = 60 Sample Mean (X) = -2.238574117 Significance Level (a) = 0.05Descriptive statistics Question 3 WRT (ILU.AX) WRT (BLD.AX) Mean 0.874635732 Mean -0.238574117 Standard Error 0.645214827 Standard Error 0.843127437 Median 1.243671007 Median 0.135501355 Mode #N/A Mode 0 Standard Deviation 4.997812556 Standard Deviation 6.530837047 Sample Variance 24.97813034 Sample Variance 42.65183253 Kurtosis 0.00598448 Kurtosis 23.12353498 Skewness -0.163788123 Skewness -3.534646635 Range 24.48791128 Range 54.7810215 Minimum -11.38996139 Minimum -39.81623277 Maximum 13.09794989 Maximum 14.96478873 Sum 52.47814392 Sum -14.31444704 Count 60 Count 60
Step by Step Solution
There are 3 Steps involved in it

Get step-by-step solutions from verified subject matter experts