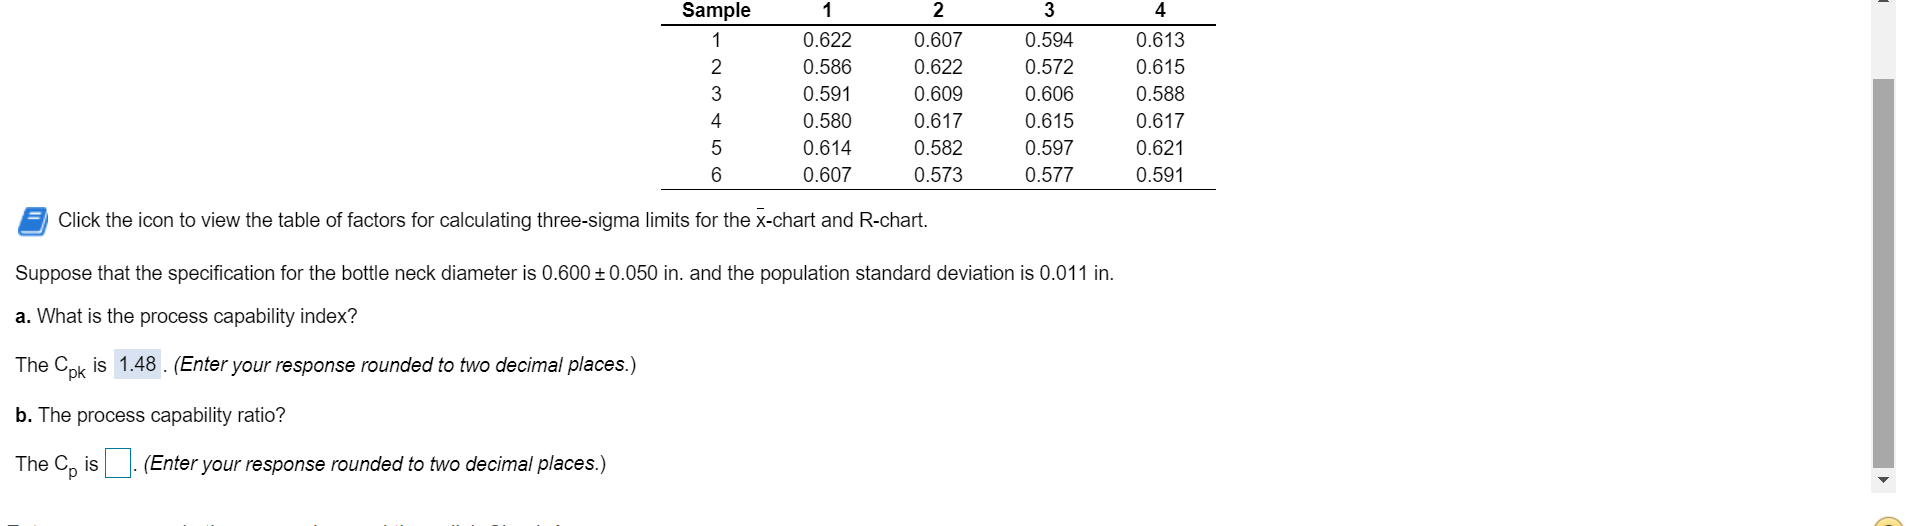
Question: 2 Sample 1 2 3 4 5 6 1 0.622 0.586 0.591 0.580 0.614 0.607 0.607 0.622 0.609 0.617 0.582 0.573 3 0.594 0.572 0.606

2 Sample 1 2 3 4 5 6 1 0.622 0.586 0.591 0.580

2 Sample 1 2 3 4 5 6 1 0.622 0.586 0.591 0.580 0.614 0.607 0.607 0.622 0.609 0.617 0.582 0.573 3 0.594 0.572 0.606 0.615 0.597 0.577 4 0.613 0.615 0.588 0.617 0.621 0.591 Click the icon to view the table of factors for calculating three-sigma limits for the x-chart and R-chart. Suppose that the specification for the bottle neck diameter is 0.600 + 0.050 in, and the population standard deviation is 0.011 in. a. What is the process capability index? The Cpk is 1.48. (Enter your response rounded to two decimal places.) b. The process capability ratio? The Cp is (Enter your response rounded to two decimal places.)

Step by Step Solution

There are 3 Steps involved in it

1 Expert Approved Answer
Step: 1 Unlock blur-text-image
Question Has Been Solved by an Expert!

Get step-by-step solutions from verified subject matter experts

Step: 2 Unlock
Step: 3 Unlock

Students Have Also Explored These Related General Management Questions!