

Question: 2 Select the range A4:G9 and create a clustered column chart Position the clustered column chart so that the upper-left cormer is within cell A15
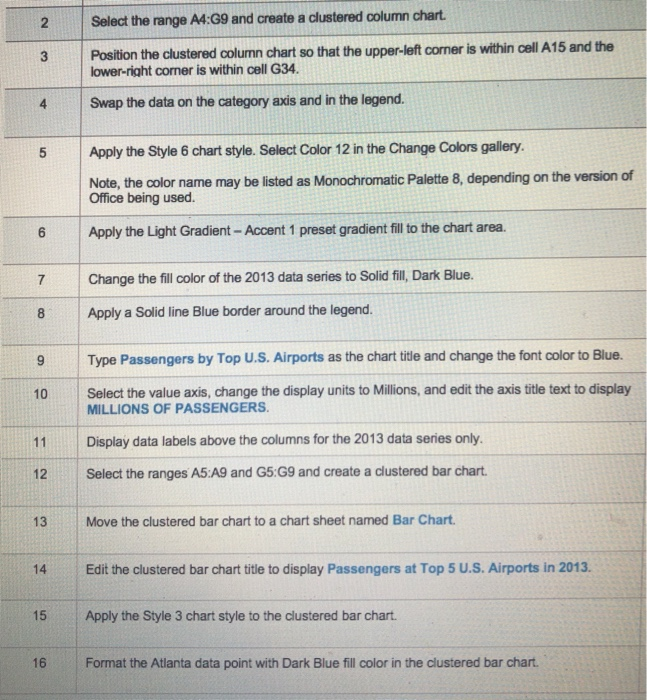
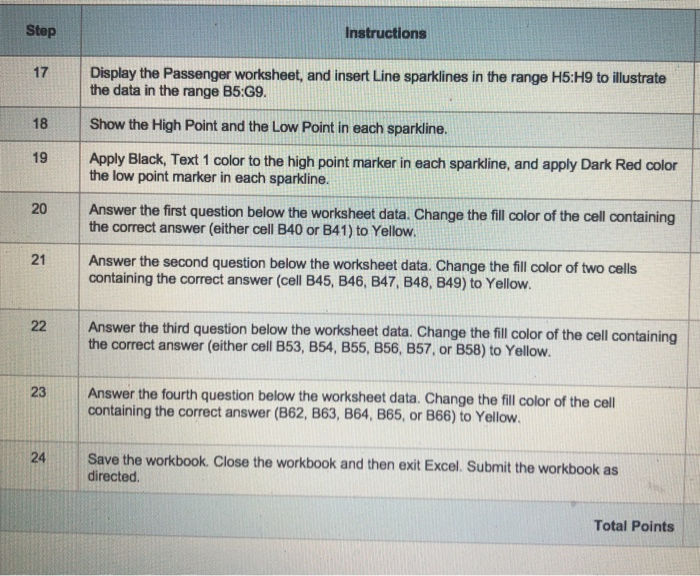
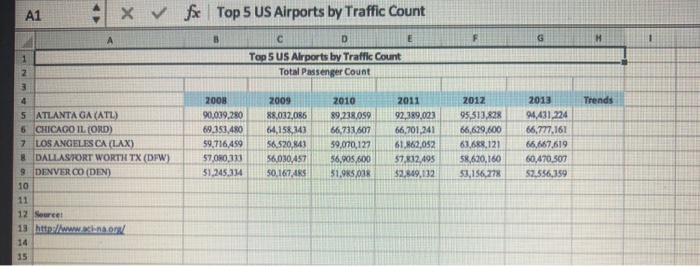
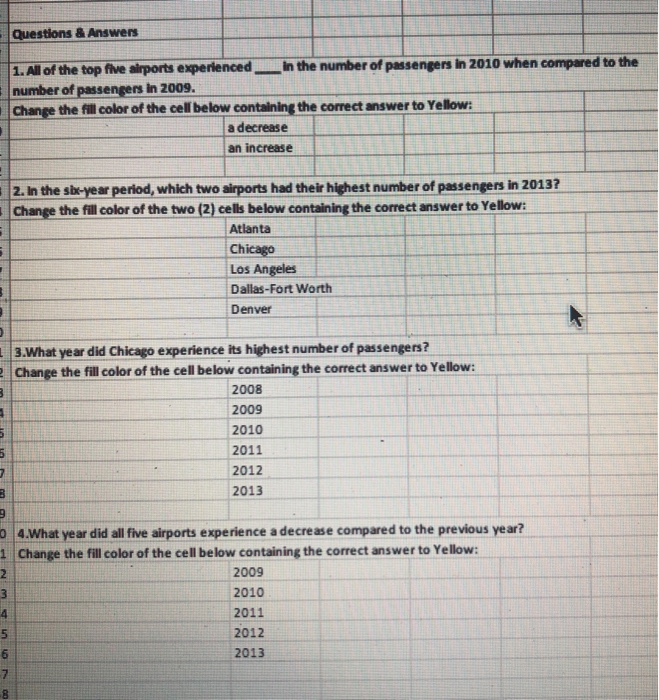
2 Select the range A4:G9 and create a clustered column chart Position the clustered column chart so that the upper-left cormer is within cell A15 and the lower-right corner is within cell G34 4 Swap the data on the category axis and in the legend 5 Apply the Style 6 chart style. Select Color 12 in the Change Colors gallery Note, the color name may be listed as Monochromatic Palette 8, depending on the version of Office being used 6 Apply the Light Gradient - Accent 1 preset gradient fill to the chart area. 7 Change the fill color of the 2013 data series to Solid fill Dark Blue. 7 8 Apply a Solid line Blue border around the legend. 9 Type Passengers by Top U.S. Airports as the chart title and change the font color to Blue. 10 Select the value axis, change the display units to Millions, and edit the axis title text to display 11Display data labels above the columns for the 2013 data series only. 12 Select the ranges A5:A9 and G5:G9 and create a clustered bar chart 13 Move the clustered bar chart to a chart sheet named Bar Chart 14 Edit the clustered bar chart title to display Passengers at Top 5 U.S. Airports in 2013. 15 Apply the Style 3 chart style to the clustered bar chart MILLIONS OF PASSENGERS 16 Format the Atlanta data point with Dark Blue fill color in the clustered bar chart Instructions Step 17 Display the Passenger worksheet, and insert Line sparklines in the range H5:H9 to illustrate the data in the range B5:G9. 18 Show the High Point and the Low Point in each sparkline 19 Apply Black, Text 1 color to the high point marker in each sparkline, and apply Dark Red color the low point marker in each sparkline. 20 Answer the first question below the worksheet data. Change the fill color of the cell containing the correct answer (either cell B40 or B41) to Yellow Answer the second question below the worksheet data. Change the fill color of two cells containing the correct answer (cell B45, B46, B47, B48, B49) to Yellow. 22 Answer the third question below the worksheet data. Change the fill color of the cell containing l the correct answer (either cell B53, B54, B55, B56, B57, or B58) to Yellow. Answer the fourth question below the worksheet data. Change the fill color of the cell containing the correct answer (862, B63, B64, B65, or B66) to Yellow Save the workbook. Close the workbook and then exit Excel. Submit the workbook as directed Total Points 9 1 fe . Top 5 US Airports by Traffic Count X v/ A1 Top 5 US Airports by Traffic Count Total Passenger Count 2008 2011 2012 2013 Trends 2010 5 ATLANTA GA (ATL) 6 CHICAGO IL (ORD) 7 LOSANGELES CA (LAX) 8 DALLASTORT WORTH TX (DFW)7,080,33356030,45756,905,600 57 832,495 90,039.280 88,032,086 89,238059 92,389,023 95.513,82894431 224 69.353,48064,158,343 i 66,733.607 | . 66.201,241 | 66.629,600 |-66,777,161 59,716,459 56520,84359,070,127 61.862,05263.688,12166,667 619 60,470.507 1,245 334 so.167,48S1.985,038$2.849,13253,156.27852,556359 58.620,160 DENVER CO (DEN) 10 12 13 http:lwww.aci-na.0 14 15 Seureet Questions & Answers 1.All of the top five airports experienced in the number of passengers in 2010 when compared to the number of passengers in 2009. Change the fill olor of the cell below containing the correct answer to Yellow: a decrease an increase 2. In the sbr-year period, which two airports had their highest number of passengers in 2013? Change the fill color of the two (2) cells below containing the correct answer to Yellow: Atlanta Chicago Los Angeles Dallas-Fort Worth Denver 3.What year did Chicago experience its highest number of passengers? Change the fill color of the cell below containing the correct answer to Yellow: 2008 2009 2010 2011 2012 2013 0 4.What year did all five airports experience a decrease compared to the previous ye ar? 1 Change the fill color of the cell below containing the correct answer to Yellow 2009 2010 2011 2012 2013 5
Step by Step Solution
There are 3 Steps involved in it

Get step-by-step solutions from verified subject matter experts