

Question: 2) Show your work to solve this problem With this background on how prices should be set, let's examine a simple example to incorporate the
 2) Show your work to solve this problem
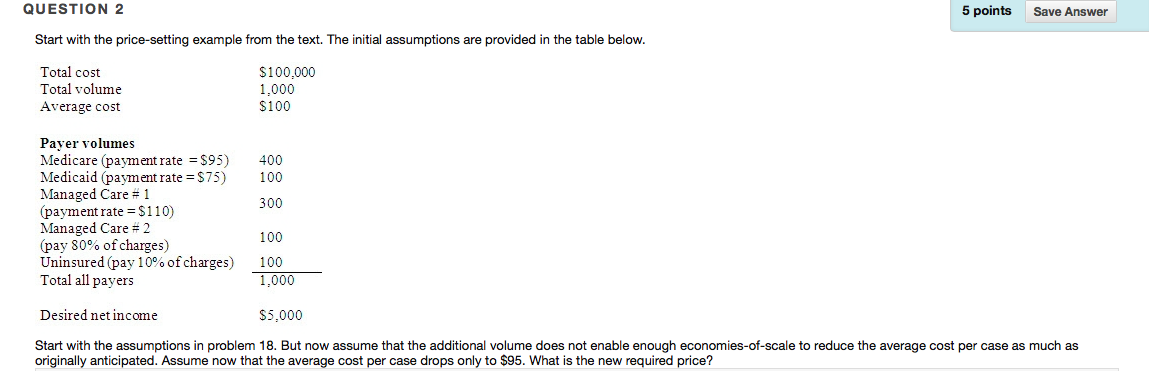
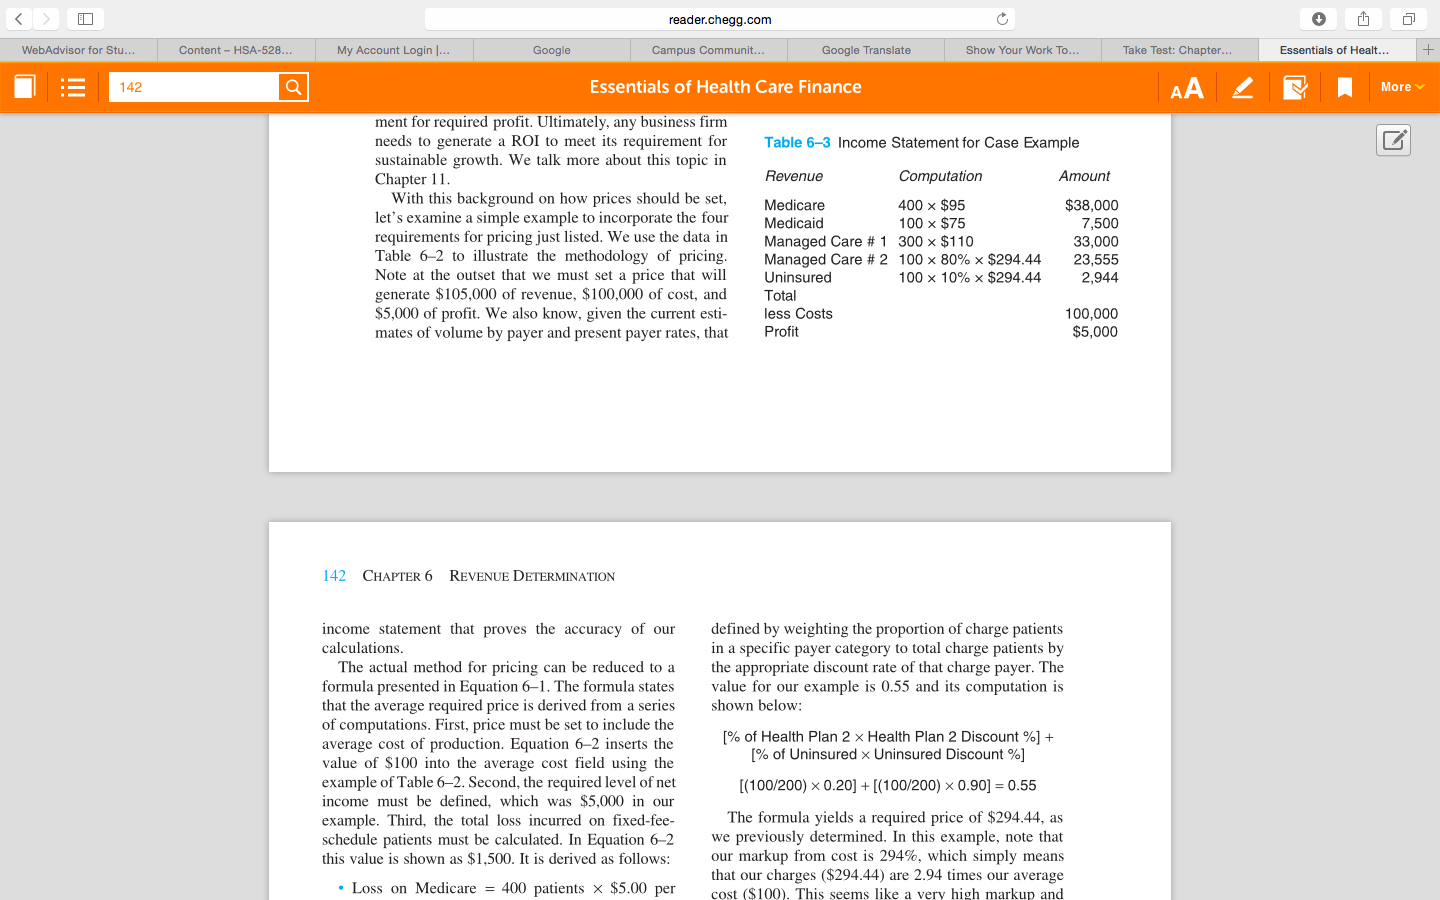
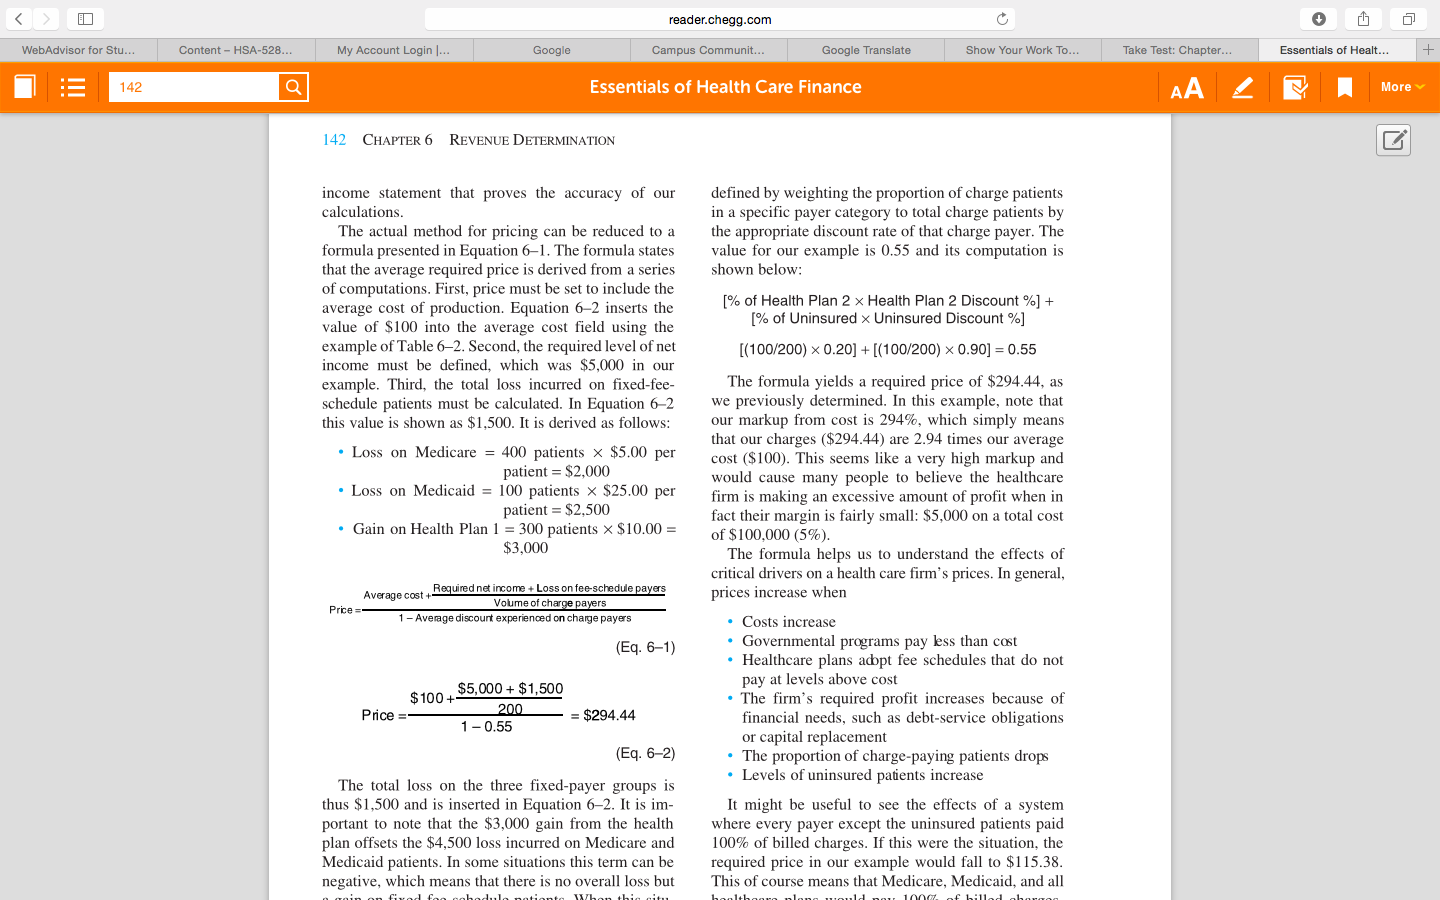
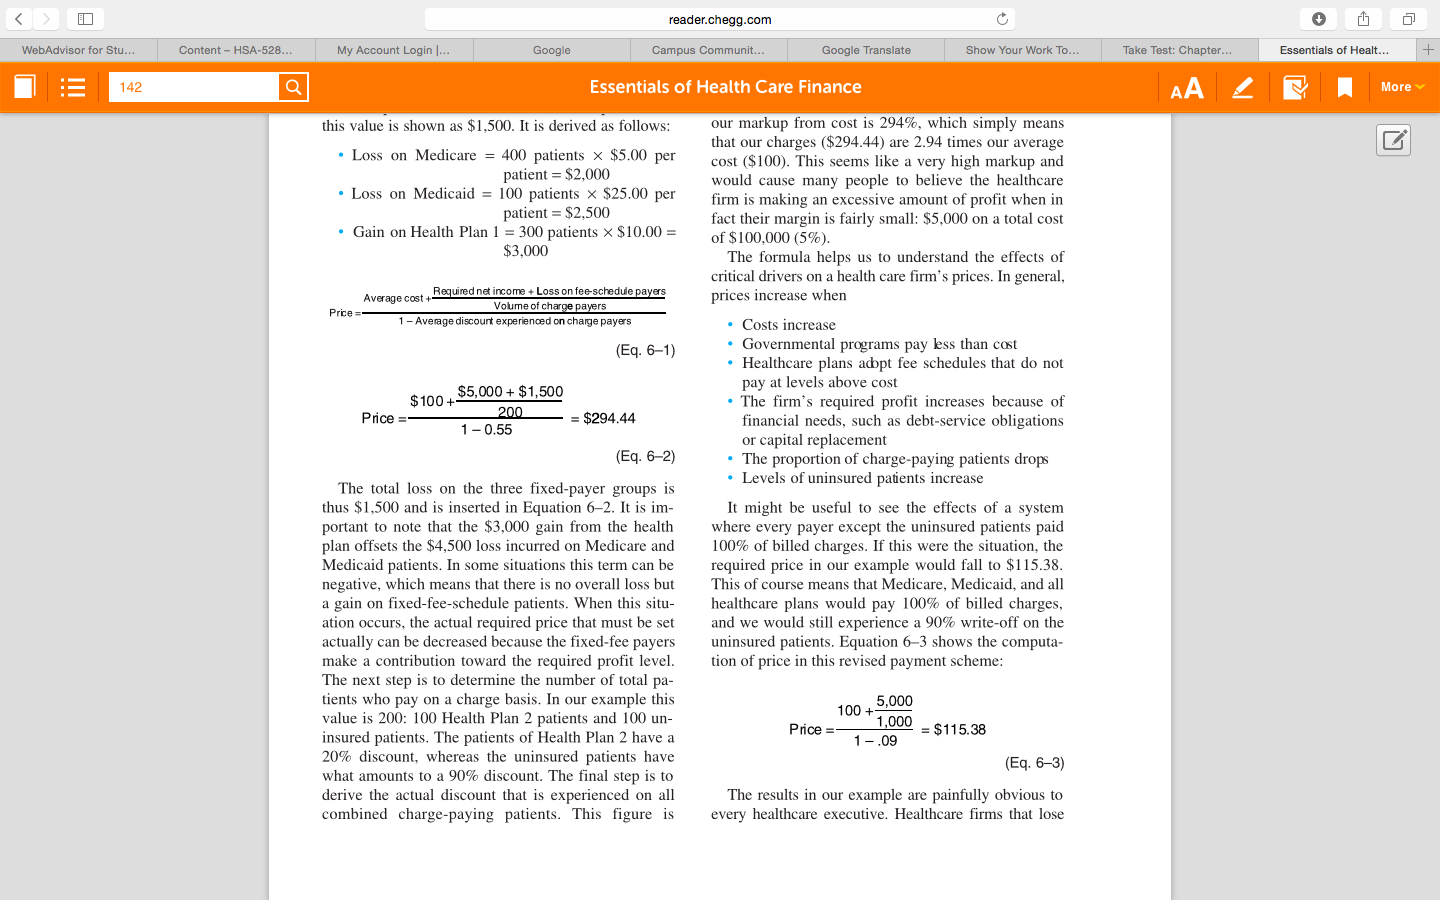
With this background on how prices should be set, let's examine a simple example to incorporate the four requirements for pricing just listed. We use the data in Table 6-2 to illustrate the methodology of pricing. Note at the outset that we must set a price that will generate $105,000 of revenue, $100,000 of cost, and $5,000 of profit. We also know, given the current estimates of volume by payer and present payer rates, that income statement that proves the accuracy of our calculations. The actual method for pricing can be reduced to a formula presented in Equation 6-1. The formula states that the average required price is derived from a series of computations. First, price must be set to include the average cost of production. Equation 6-2 inserts the value of $100 into the average cost field using the example of Table 6-2. Second, the required level of net income must be defined, which was $5,000 in our example. Third, the total loss incurred on fixed-fee-schedule patients must be calculated. In Equation 6-2 this value is shown as $1, 500. It is derived as follows: Loss on Medicare = 400 patients times $5.00 per patient = $2,000 Loss on Medicaid = 100 patients times $25.00 per patient = $2, 500 Gain on Health Plan 1 = 300 patients times $10.00 = $3,000 Price = Average cost + Required net income + Loss on fee-schedule payers/Volume of charge payers/1 - Average discount experienced on charge payers Price = $100 + $5,000 + $1, 500/200/1 - 0.55 = $294.44 The total loss on the three fixed-payer groups is thus $1, 500 and is inserted in Equation 6-2. It is important to note that the $3,000 gain from the health plan offsets the $4, 500 loss incurred on Medicare and Medicaid patients. In some situations this term can be negative, which means that there is no overall loss but defined by weighting the proportion of charge patients in a specific payer category to total charge patients by the appropriate discount rate of that charge payer. The value for our example is 0.55 and its computation is shown below: [% of Health Plan 2 times Health Plan 2 Discount %] + [% of Uninsured times Uninsured Discount %] [(100/200) times 0.20) + [(100/200) times 0.90] = 0.55 The formula yields a required price of $294.44, as we previously determined. In this example, note that our markup from cost is 294%. which simply means that our charges ($294.44) are 2.94 times our average cost ($100). This seems like a very high markup and would cause many people to believe the healthcare firm is making an excessive amount of profit when in fact their margin is fairly small: $5,000 on a total cost of $100,000 (5%). The formula helps us to understand the effects of critical drivers on a health care firm's prices. In general, prices increase when Costs increase Governmental programs pay less than cost Healthcare plans adapt fee schedules that do not pay at levels above cost The firm's required profit increases because of financial needs, such as debt-service obligations or capital replacement The proportion of charge-paying patients drops Levels of uninsured patients increase It might be useful to see Start with the price-setting example from the text. The initial assumptions are provided in the table below. Start with the assumptions in problem 18. But now assume that the additional volume does not enable enough economies-of-scale to reduce the average cost per case as much as originally anticipated. Assume now that the average cost per case drops only to $95. What is the new required price
Step by Step Solution
There are 3 Steps involved in it

Get step-by-step solutions from verified subject matter experts