

Question: 2. Shown below is a residual plot that plots the explanatory variable (math grade) against the residuals for the response variable (SAT math score) after
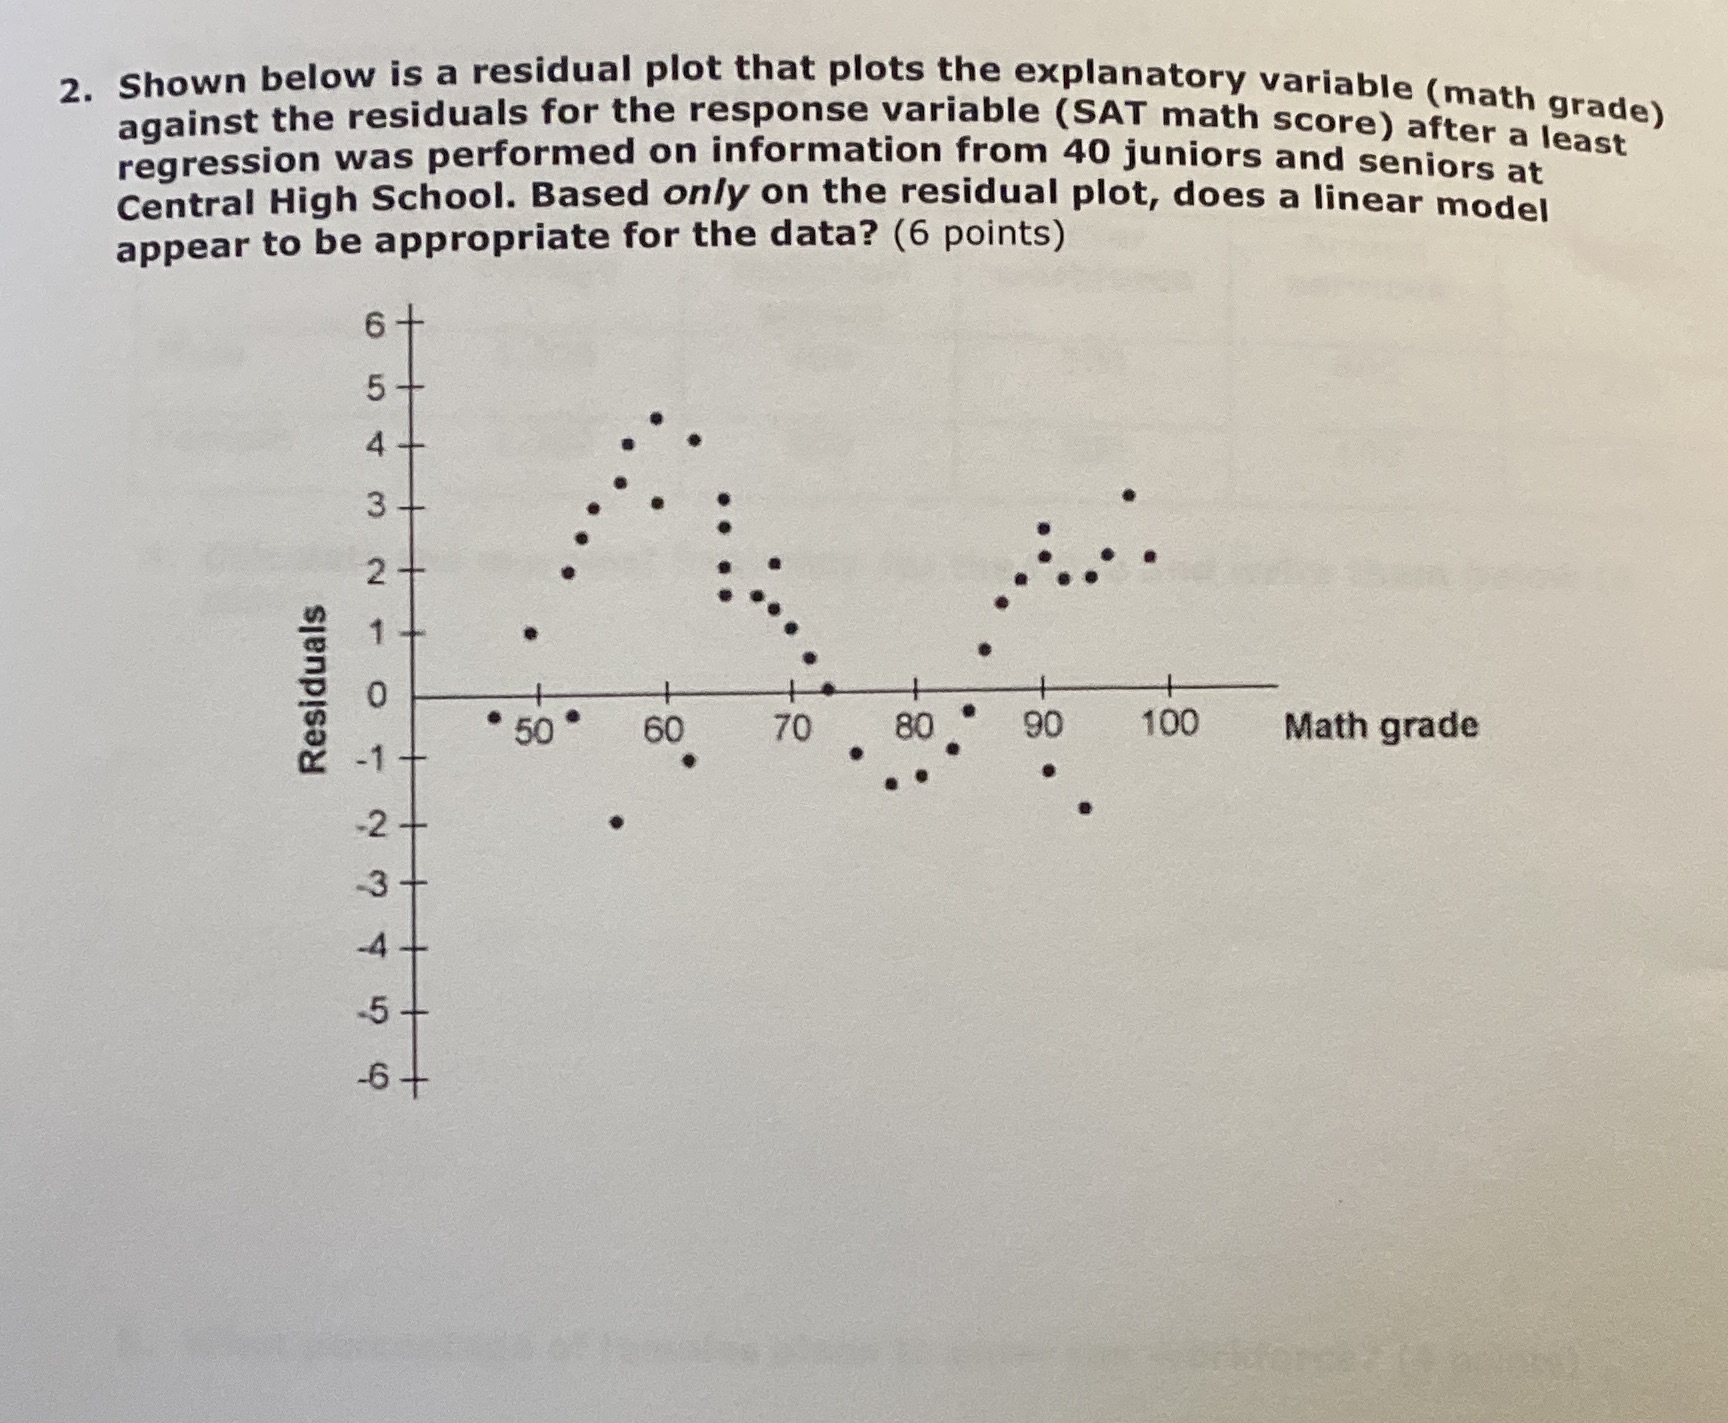
2. Shown below is a residual plot that plots the explanatory variable (math grade) against the residuals for the response variable (SAT math score) after a least regression was performed on information from 40 juniors and seniors at Central High School. Based only on the residual plot, does a linear model appear to be appropriate for the data? (6 points) 6+ A 3 Residuals . 50 * 60 70 80 90 100 Math grade +
Step by Step Solution
There are 3 Steps involved in it
1 Expert Approved Answer
Step: 1 Unlock

Question Has Been Solved by an Expert!
Get step-by-step solutions from verified subject matter experts
Step: 2 Unlock
Step: 3 Unlock