

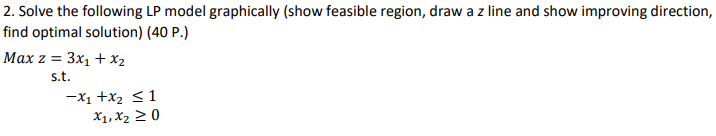
Question: 2. Solve the following LP model graphically (show feasible region, draw a z line and show improving direction, find optimal solution) (40 P.) Max z
Step by Step Solution
There are 3 Steps involved in it
1 Expert Approved Answer
Step: 1 Unlock

Question Has Been Solved by an Expert!
Get step-by-step solutions from verified subject matter experts
Step: 2 Unlock
Step: 3 Unlock