

Question: 2 STA 1 5 0 1 / 0 1 3 / 0 QUESTION 2 A statistician at the weather Bureau presented the average Gauteng temperature
STA
QUESTION
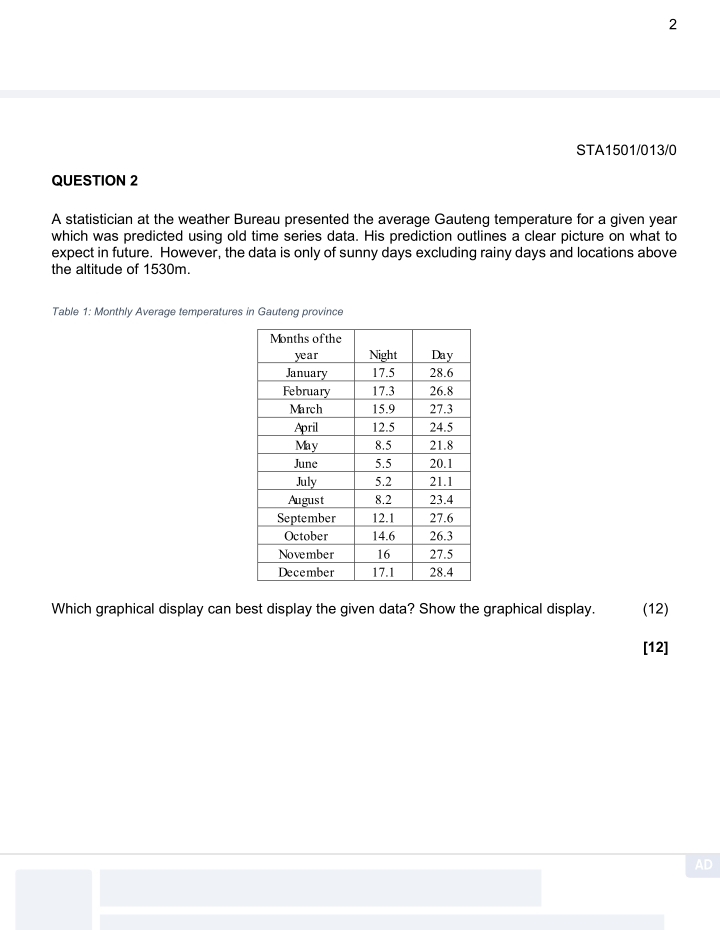
A statistician at the weather Bureau presented the average Gauteng temperature for a given year which was predicted using old time series data. His prediction outlines a clear picture on what to expect in future. However, the data is only of sunny days excluding rainy days and locations above the altitude of
Table : Monthly Average temperatures in Gauteng province
tabletableMonths of theyearNight,DayJanuaryFebruaryMurchAprilMayJuneJulyAugustSeptemberOctoberNovemberDecember
Which graphical display can best display the given data? Show the graphical display.
Step by Step Solution
There are 3 Steps involved in it
1 Expert Approved Answer
Step: 1 Unlock

Question Has Been Solved by an Expert!
Get step-by-step solutions from verified subject matter experts
Step: 2 Unlock
Step: 3 Unlock