

Question: 2. Statistical measures of standalone risk Remember, the expected value of a probablity distribution is a statistical measure of the avernge (mean) value expected to
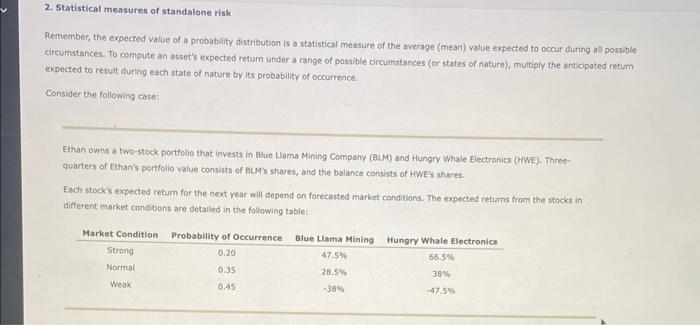
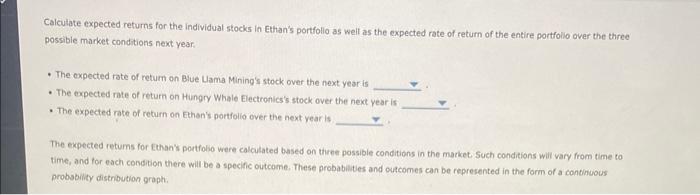
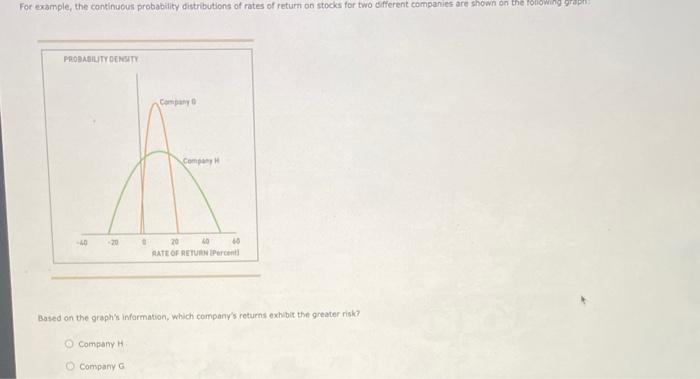
2. Statistical measures of standalone risk Remember, the expected value of a probablity distribution is a statistical measure of the avernge (mean) value expected to occur during all possible circumstances, To compute an asset's expected return under a range of possible circumstances (or states of nature), multiply the anticipated return expected to result during each state of nature by its probability of occurrence. Consider the following case: Ethan owns a two-stock portfolio that invests in Blue Llama Mining Company (BuM) and Hungry Whale Electronics (HWE). Throequarters of Ethan's portfolio value consists of BuM's shares, and the balance consists of HWE's shares. Each stock's expected return for the next year will depend on forecasted market conditions. The expected returns from the stocks in different market conditions are detailed in the following table: Calculate expected retums for the individual stocks in Ethan's portfollo as weil as the expected rate of return of the entire portfolio over the three possible market conditions next year. - The expected rate of return on Blue Lama Mining's stock over the next year is - The expected rate of return on Hungry Whale Electronics's stock over the next year is - The expected rate of return on Ethen's portfolio over the next year is The expected retums for Ethan's potfolio were calculated based on tiree possible conditions in the market. Such conditions wili vary from time to time, and for each consition there will be a specific outcome. These probabilities and outcomes can be represented in the form of a conthoous probsbinty distribution graphi. Based on the graph's infarmation, which company's returns exhibit the greater risk? Company H Company G
Step by Step Solution
There are 3 Steps involved in it

Get step-by-step solutions from verified subject matter experts