

Question: 2. Statistical measures of stand-alone risk Remember, the expected value of a probability distribution is a statistical measure of the average (mean) value expected to
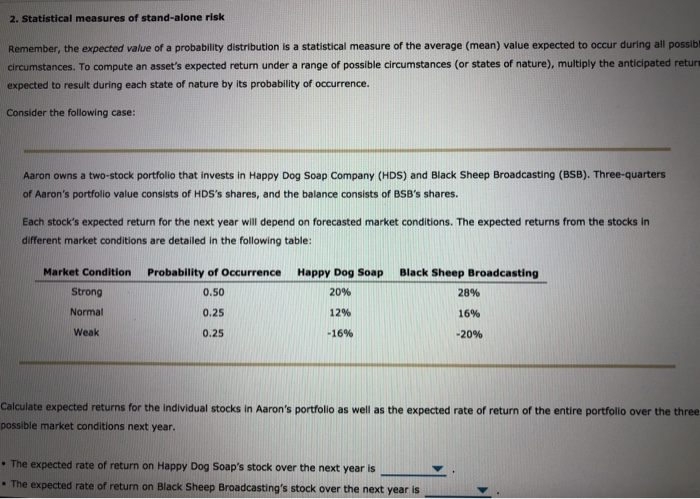
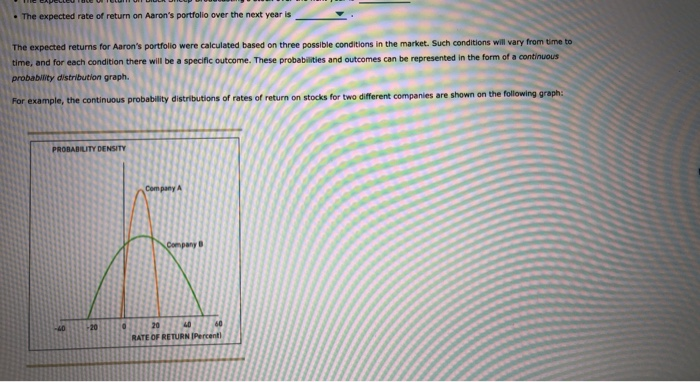

2. Statistical measures of stand-alone risk Remember, the expected value of a probability distribution is a statistical measure of the average (mean) value expected to occur during all possib circumstances. To compute an asset's expected returm under a range of possible circumstances (or states of nature), multiply the anticipated returr expected to result during each state of nature by its probability of occurrence. Consider the following case: Aaron owns a two-stock portfolio that invests in Happy Dog Soap Company (HDS) and Black Sheep Broadcasting (BSB). Three-quarters of Aaron's portfolio value consists of HDS's shares, and the balance consists of BSB's shares. forecasted market conditions. The expected returns from the stocks in Each stock's expected return for the next year will depend on different market conditions are detailed in the following table: Black Sheep Broadcasting Market Condition Probability of Occurrence Happy Dog Soap Strong 0.50 20% 28% Normal 0.25 12% 16% Weak 0.25 -16% -20% Calculate expected returns for the individual stocks in Aaron's portfolio as well as the expected rate of return of the entire portfolio over the three possible market conditions next year. . The expected rate of return on Happy Dog Soap's stock over the next year is The expected rate of return on Black Sheep Broadcasting's stock over the next year is The expected rate of return on Aaron's portfolio over the next year is The expected returns for Aaron's portfolio were calculated based on three possible conditions in the market. Such conditions will vary from time to a specific outcome. These probabilities and outcomes can be represented in the form of a continuous time, and for each condition there will be probability distribution graph. For example, the continuous probability distributions of rates of return on stocks for two different companies are shown on the following graph: PROBABILITY DENSITY Company A Company B 60 20 40 -20 -40 RATE OF RETURN IPercent) Based on the graph's information, which of the following statements is true? Company A has lower risk. Company B has lower risk
Step by Step Solution
There are 3 Steps involved in it

Get step-by-step solutions from verified subject matter experts