

Question: 2 statistics Wait-Times ( Raw Data, Software Required): There are three registers at the local grocery store. I suspect the mean wait-times for the registers
2 statistics
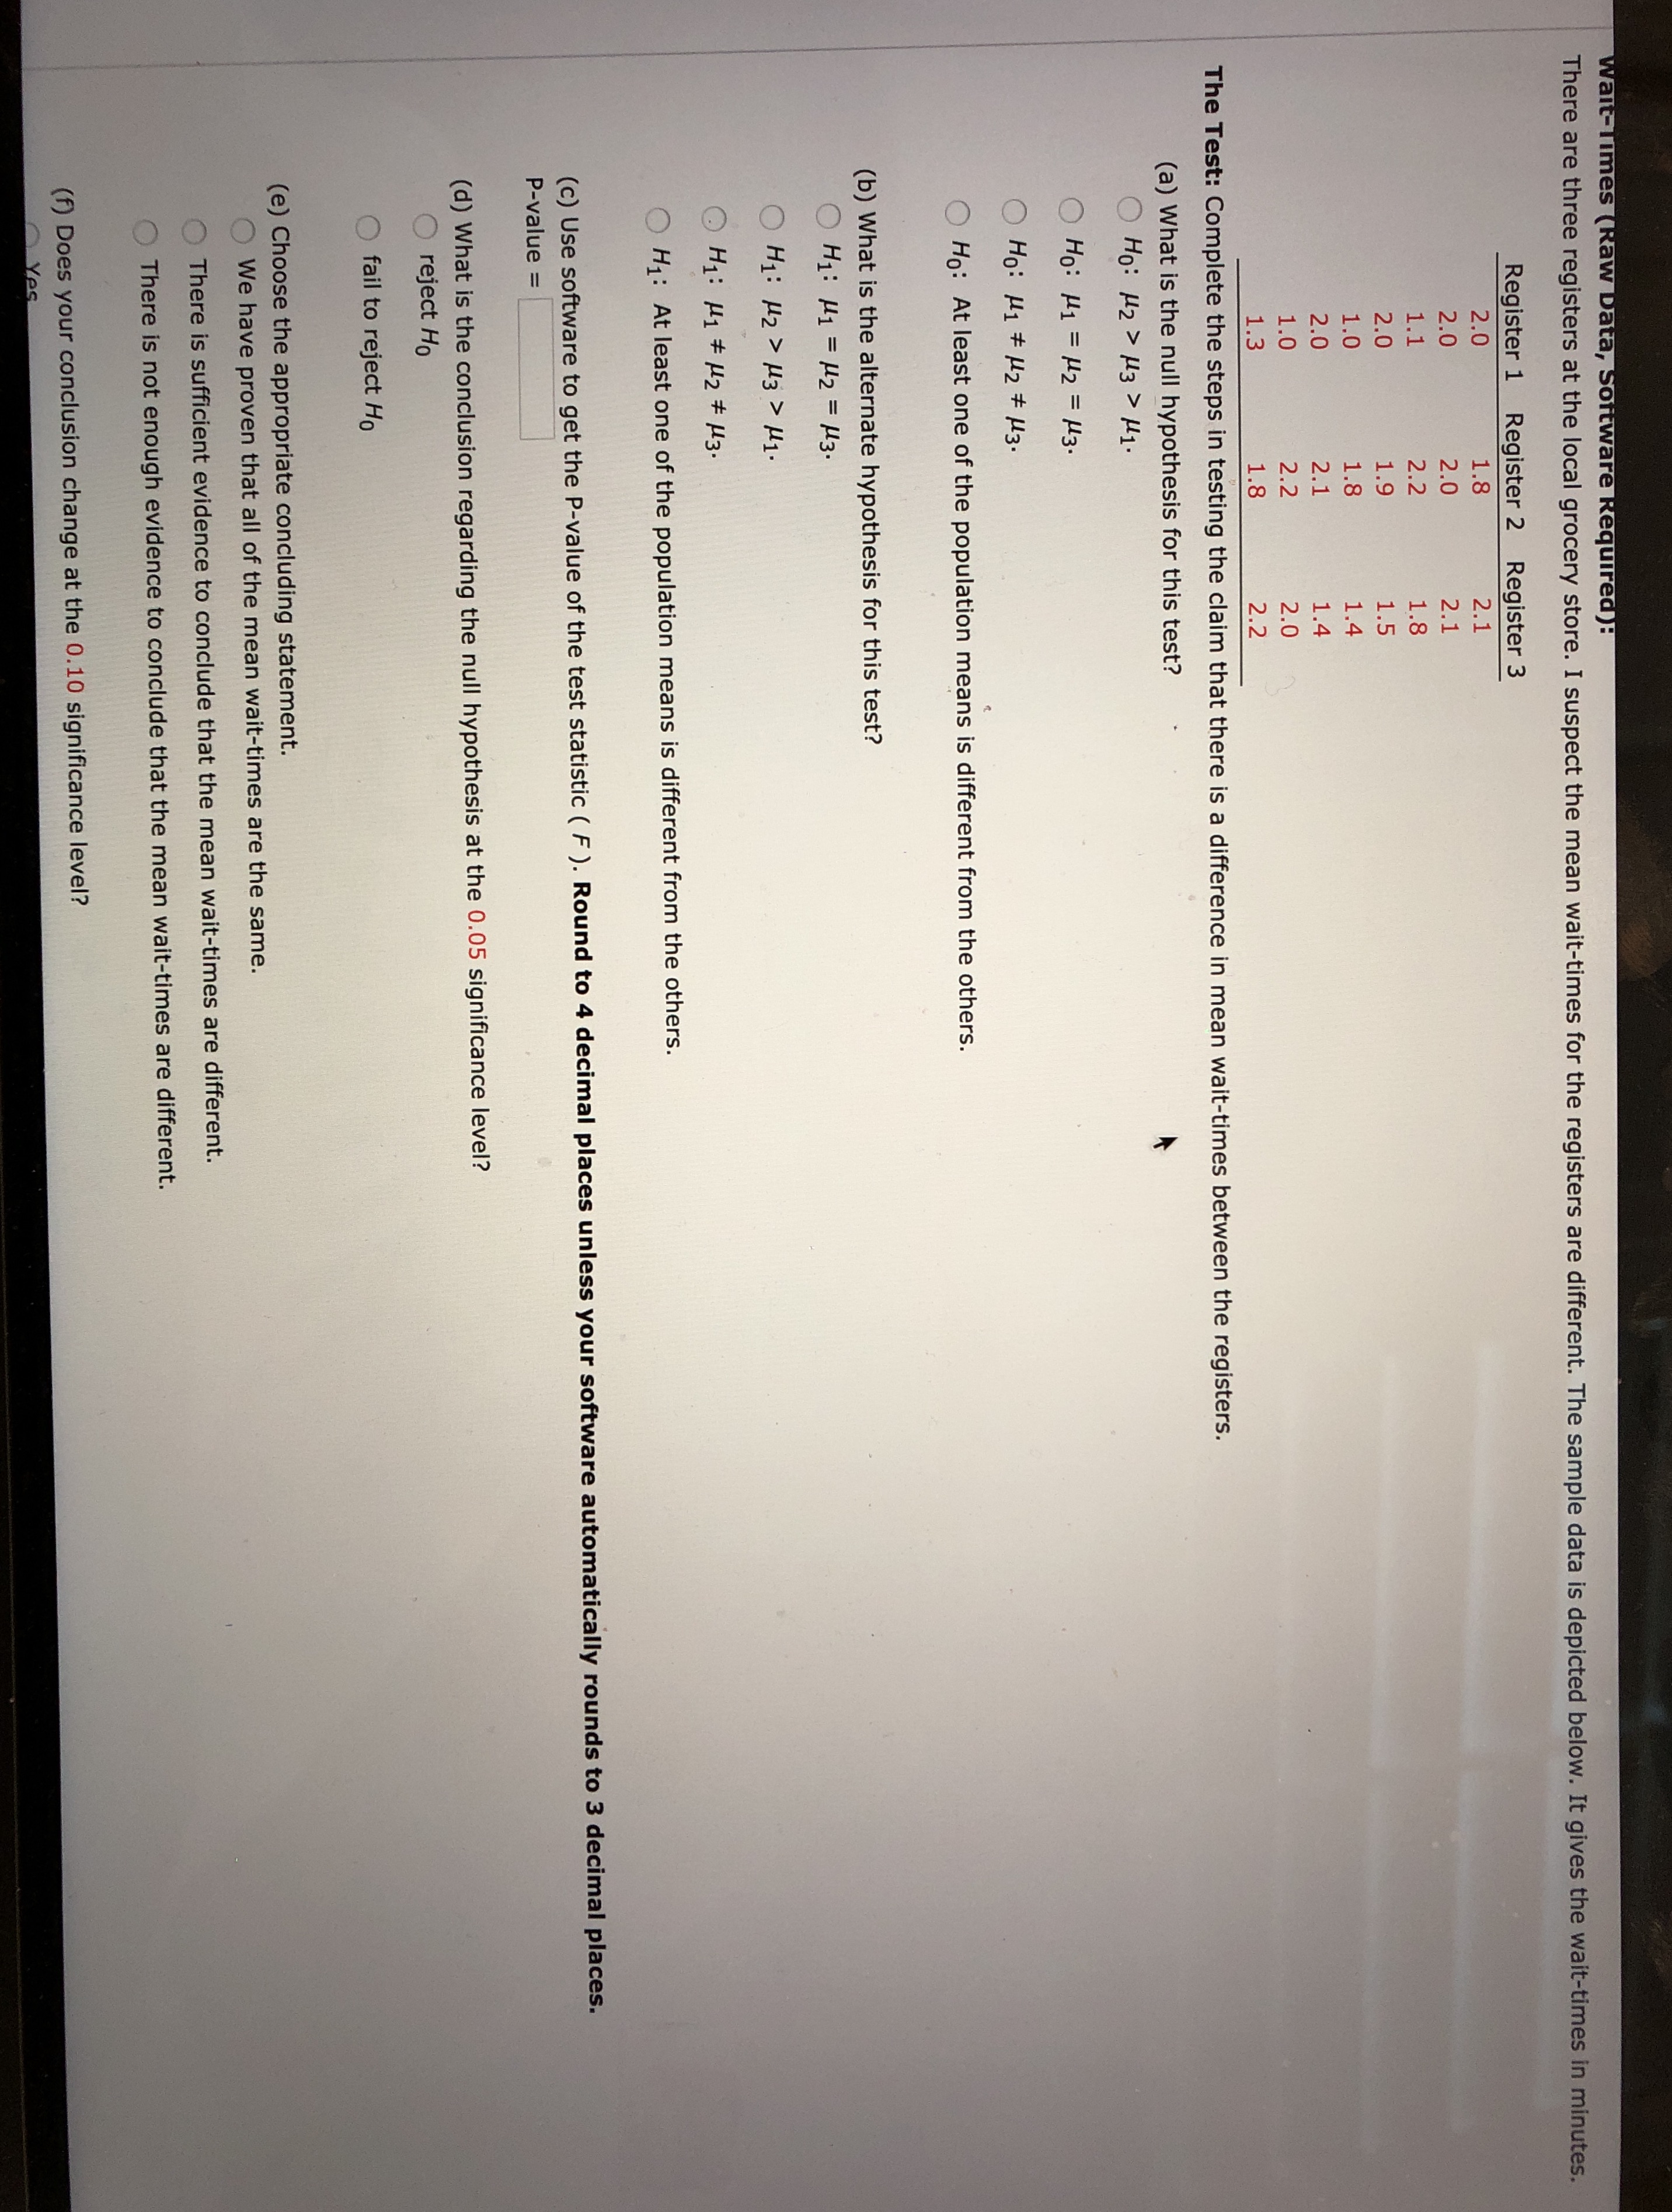
Wait-Times ( Raw Data, Software Required): There are three registers at the local grocery store. I suspect the mean wait-times for the registers are different. The sample data is depicted below. It gives the wait-times in minutes. Register 1 Register 2 Register 3 2.0 2.0 2.0 2.1 1.1 2.2 1.8 2.0 1.9 1.5 1.0 1.8 1.4 2.0 2.1 1.4 1.0 2.2 2.0 1.8 2.2 The Test: Complete the steps in testing the claim that there is a difference in mean wait-times between the registers. (a) What is the null hypothesis for this test? O Ho: H2 > (3 > H 1 . O Ho: H1 = H2 = 13. O Ho: H1 # 12 # 13. Ho: At least one of the population means is different from the others. (b ) What is the alternate hypothesis for this test ? O H1: H1 = 12 = 13. OH 1 : 1 2 > 13 > M 1 . OH1: H1 $ 12 # H3. H1: At least one of the population means is different from the others. (c) Use software to get the P-value of the test statistic ( F ). Round to 4 decimal places unless your software automatically rounds to 3 decimal places. P-value = (d) What is the conclusion regarding the null hypothesis at the 0.05 significance level? reject Ho fail to reject Ho (e) Choose the appropriate concluding statement. We have proven that all of the mean wait-times are the same. There is sufficient evidence to conclude that the mean wait-times are different. There is not enough evidence to conclude that the mean wait-times are different. (f) Does your conclusion change at the 0.10 significance level
Step by Step Solution
There are 3 Steps involved in it

Get step-by-step solutions from verified subject matter experts