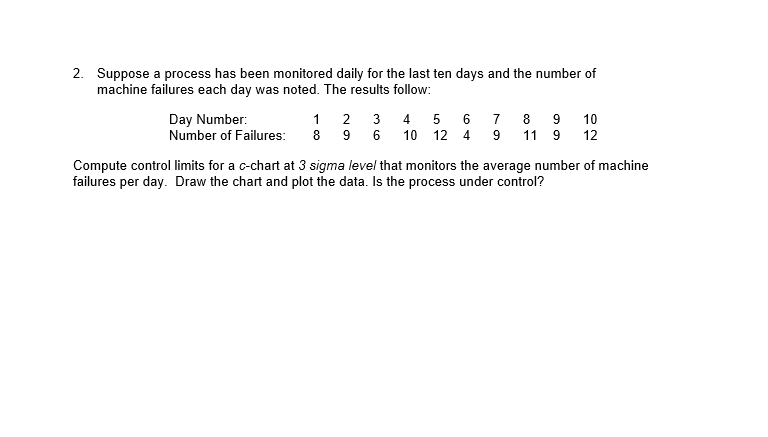
Question: 2. Suppose a process has been monitored daily for the last ten days and the number of machine failures each day was noted. The results

2. Suppose a process has been monitored daily for

2. Suppose a process has been monitored daily for the last ten days and the number of machine failures each day was noted. The results follow: Compute control limits for a c-chart at 3 sigma level that monitors the average number of machine failures per day. Draw the chart and plot the data. Is the process under control

Step by Step Solution

There are 3 Steps involved in it

1 Expert Approved Answer
Step: 1 Unlock blur-text-image
Question Has Been Solved by an Expert!

Get step-by-step solutions from verified subject matter experts

Step: 2 Unlock
Step: 3 Unlock

Students Have Also Explored These Related General Management Questions!