

Question: 2. Suppose the table below shows the potential outcomes, YA and YB, given receipt of treatment A (placebo) and B (active experimental treatment) for 10
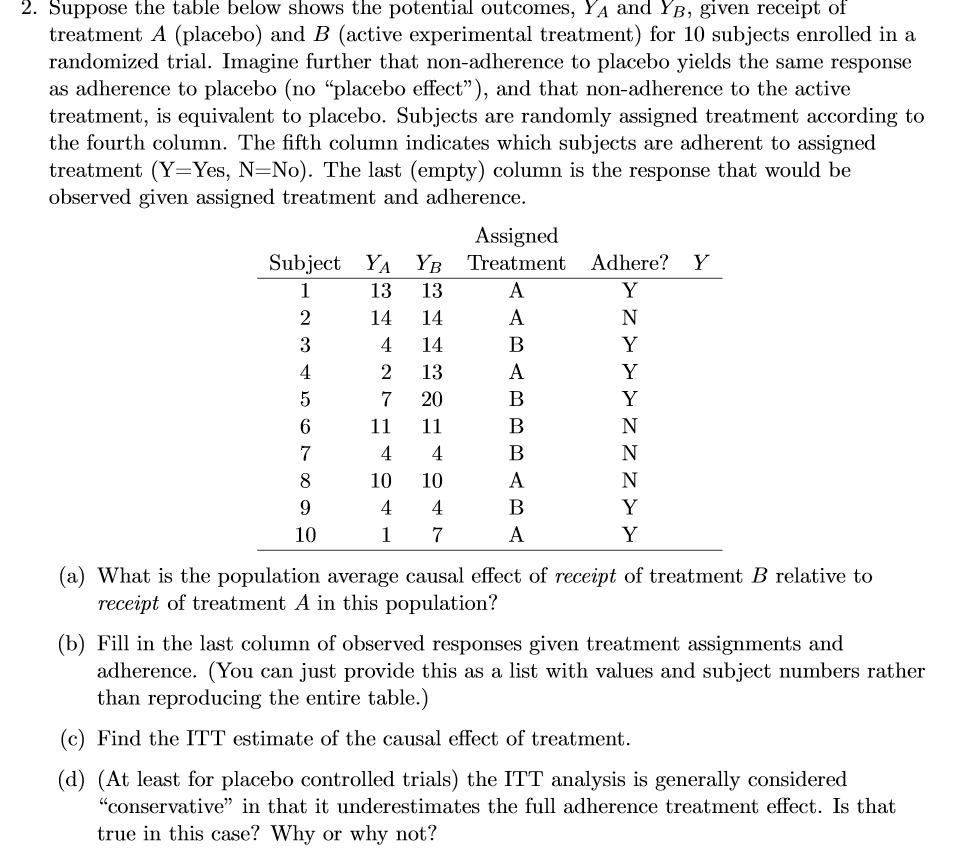
2. Suppose the table below shows the potential outcomes, YA and YB, given receipt of treatment A (placebo) and B (active experimental treatment) for 10 subjects enrolled in a randomized trial. Imagine further that nonadherence to placebo yields the same response as adherence to placebo [no \"placebo effect\"), and that nonadherence to the active treatment, is equivalent to placebo. Subjects are randomly aesigned treatment according to the fourth column. The fth column indicates which subjects are adherent to assigned treatment (Y=Yes, N=No}. The last (empty) column is the response that would be observed given assigned treatment and adherence. Assigned Subject YA YB Treatment Adhere? Y 1 13 13 A Y 2 14 14 A N 3 4 14 B Y 4 2 13 A Y 5 7 20 B Y 5 1 1 1 1 B N 7 4 4 B N 8 10 10 A N 9 4 4 B Y 1|]| l 7 A Y (a) What is the population average causal effect of receipt of treatment B relative to receipt of treatment A in this population? (1)) Fill in the last column of observed responses given treatment assignments and adherence. (You can just provide this as a list with values and subject numbers rather than reproducing the entire table.) (3) Find the ITT estimate of the causal effect of treatment. (d) (At least for placebo controlled trials} the ITT analysis is generally considered \"conservative\" in that it imderestimates the full adherence treatment effect. Is that true in this case? Why or why not
Step by Step Solution
There are 3 Steps involved in it

Get step-by-step solutions from verified subject matter experts